The Problem with "Good Enough" Quality Measurement
Most engineering organizations have a code quality tool. These tools scan your code after you commit it, report findings to a dashboard, and someone triages. This workflow worked when humans were the only ones writing code.
But now agents are writing code too. And agents don't look at dashboards.
The question I keep hearing from enterprise teams is some version of: "How do we make sure the code our AI agents produce meets the same quality standards we've spent years establishing?" The answer isn't another dashboard. It's bringing the quality intelligence directly into the context the agent reads before it writes a single line of code.
That's what Prethink does. It pre-analyzes your codebase, computes quality metrics at the method, class, and package level, and materializes the results as structured files (CSV and Markdown) that live in the repository alongside the code. When an agent opens a repo, the quality context is right there. The agent knows which methods are untested, which classes should be split, which packages are tangled in dependency cycles. It knows these things before it starts writing.
The shift
Traditional quality tools measure code and present findings on a server, a dashboard that humans visit when they remember to. Agents work inside the repository. They don't visit dashboards. They don't have accounts on your analysis server. They read files. Prethink bridges that gap by materializing quality analysis as files that live where agents work.
This document walks through the quality metrics Prethink computes, from the simplest to the most advanced. I'll explain what each metric measures, why it matters for agents specifically, and how these metrics connect to produce actionable insights.
Method-Level Metrics
Cyclomatic Complexity Baseline
Cyclomatic complexity is the most widely understood code quality metric. Thomas McCabe introduced it in 1976, and it's been a staple of static analysis ever since. The idea is straightforward: count the number of linearly independent paths through a method. Every if, for, while, switch case, catch, &&, and || adds a path. A method with no branches has cyclomatic complexity of 1. A method with a single if/else has complexity 2. A method with nested conditionals, loops, and exception handling can easily reach 20 or higher.
Every static analysis tool on the market reports cyclomatic complexity. It's table stakes. The problem is that cyclomatic complexity alone doesn't tell you enough. Two methods can both have complexity 10 and feel completely different to maintain. One might be a flat switch statement with 10 cases, easy to read, each case independent. The other might be a method with three levels of nested conditionals, genuinely hard to follow. Cyclomatic complexity can't distinguish between these cases. For an agent that needs to decide "should I modify this method or extract a new one?", that distinction matters.
Cognitive Complexity Readability
Cognitive complexity, introduced by Ann Campbell at SonarSource in 2017, improves on cyclomatic complexity by penalizing nesting depth. The deeper you nest, the more each additional branch costs. It also handles else if chains more intuitively: a sequence of else if adds 1 per branch (not 1 plus nesting), which matches how humans actually read that pattern.
Prethink computes cognitive complexity alongside cyclomatic complexity, giving you both the structural and the readability view of the same method.
Max Nesting Depth Readability
Separate from both cyclomatic and cognitive complexity, maximum nesting depth is its own signal. A method might have moderate complexity but a nesting depth of 6, meaning you're six levels of indentation deep before you reach the core logic. That method is objectively hard to read regardless of its complexity score.
When an agent encounters a method with nesting depth above 3 or 4, it should consider extracting the inner logic into a separate method rather than adding more nesting. The nesting depth metric gives the agent that signal directly.
ABC Metric Decomposition
This is where things get interesting.
The ABC metric, introduced by Jerry Fitzpatrick in 1997, decomposes method complexity into three independent dimensions:
- A (Assignments): How much data mutation is happening? Every
=, +=, variable initialization.
- B (Branches): How many function calls? Every method invocation, constructor call.
- C (Conditions): How many boolean tests? Every
==, !=, <, >, !.
ABC = sqrt(A² + B² + C²)
But the individual components are where the insight lives. A method with high A but low B and C is a data transformer: it's moving data around. A method with high B is an orchestrator: it's coordinating calls to other components. A method with high C is a decision-maker: it's full of branching logic.
This decomposition is valuable for agents because it tells them what kind of complexity they're dealing with. An agent that needs to modify an orchestrator method should think about it differently than modifying a data transformer.
Halstead Measures Information Density
Maurice Halstead's complexity measures, from his 1977 book Elements of Software Science, take a completely different approach. Instead of counting control flow structures, Halstead counts operators and operands, the lexical tokens in the code. From four basic counts (distinct operators (n1), distinct operands (n2), total operators (N1), total operands (N2)) Halstead derives:
- Volume:
N * log2(n) where N = N1+N2 and n = n1+n2. How much information the method contains.
- Difficulty:
(n1/2) * (N2/n2). How error-prone the method is.
- Estimated Bugs:
E^(2/3) / 3000 where E = Difficulty * Volume. A defect density prediction.
Why estimated bugs matter for agents
When Prethink reports that a method has 1.14 estimated bugs, that's a signal that the method is informationally dense enough that errors are statistically likely. An agent should approach modifications to that method with extra care, perhaps adding additional test coverage before making changes. Most static analysis tools skip Halstead entirely, which is a shame. The estimated bugs metric alone is worth the computation.
The Composite Debt Score
Each of these method-level metrics tells part of the story. Prethink combines them into a composite debt score:
debtScore = 0.4 * norm(cyclomaticComplexity)
           + 0.3 * norm(cognitiveComplexity)
           + 0.2 * norm(maxNestingDepth)
           + 0.1 * norm(halsteadEstimatedBugs)
The weighting reflects a pragmatic ordering: cyclomatic complexity is the most universally understood and validated predictor of defect-proneness, cognitive complexity adds the readability dimension, nesting depth catches the "deep but not complex" cases, and Halstead bugs catches the informationally dense methods.
The debt treemap visualization sizes each method by its code volume (line count) and colors it by this composite debt score. The biggest, reddest blocks are the highest-return refactoring targets.
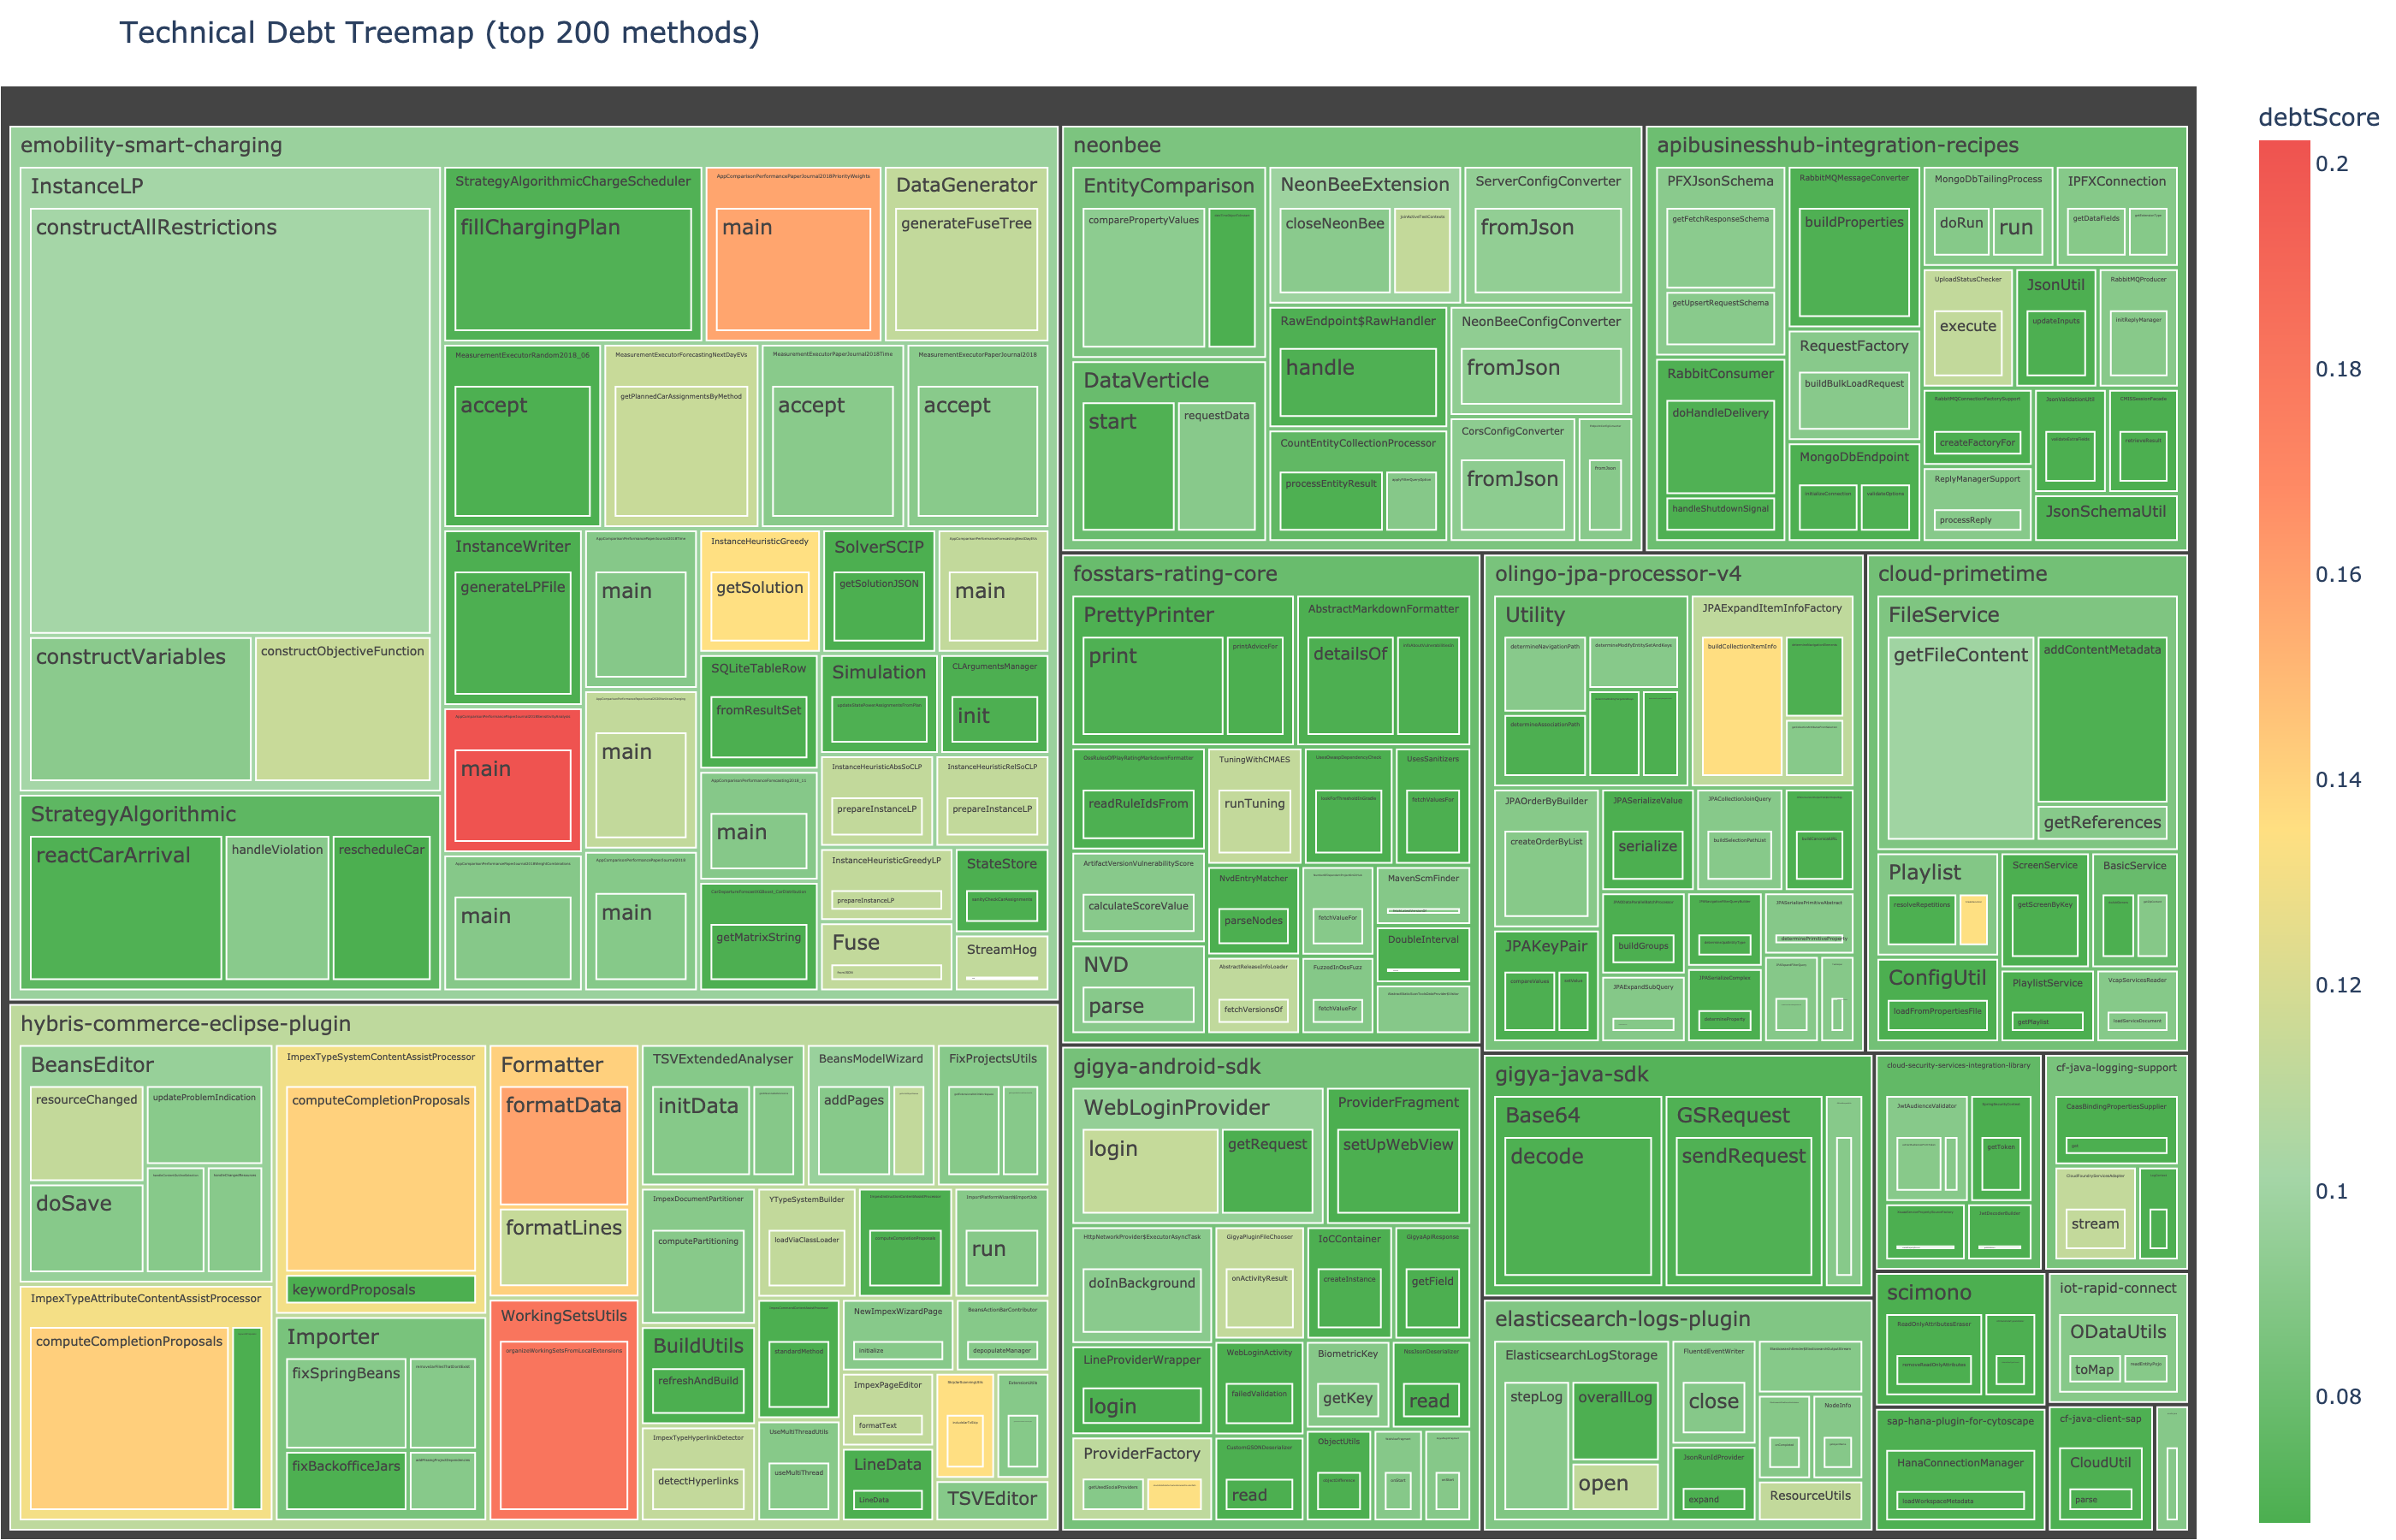
Debt treemap: method blocks sized by line count, colored by composite debt score. The biggest red blocks are the highest-return refactoring targets. An executive doesn't need to understand what cyclomatic complexity means. They need to point at a red block and say "fix that one first."
Class-Level Metrics
Method-level metrics tell you about individual methods. But classes are the unit of design in object-oriented systems, and class-level design problems (God Classes, anemic models, tangled dependencies) are often the root cause of the method-level symptoms.
Weighted Methods per Class (WMC)
WMC is the simplest class-level metric: the sum of cyclomatic complexities of all methods in the class. It's a rough measure of how much is going on. A class with WMC of 339 (yes, we found one in a large enterprise open source portfolio) is doing far too much.
LCOM4: "This Class Should Be Split" Most Actionable
This is the metric I'm most excited about, because it produces directly actionable output.
LCOM4 (Lack of Cohesion of Methods, Hitz-Montazeri variant) measures class cohesion by building a graph: nodes are methods, edges connect methods that share field access or call each other. The number of connected components in that graph is the LCOM4 score.
LCOM4 = 1 means the class is cohesive: all its methods are related through shared state.
LCOM4 = 3 means the class has three independent groups of methods that don't interact. In plain language: this class should be split into 3 classes.
That's the kind of output an agent can act on. When Prethink tells an agent "this class has LCOM4 = 3", the agent knows not to add more methods to it. If it needs to add functionality, it should consider which of the three groups the new method belongs to and whether the split should happen first.
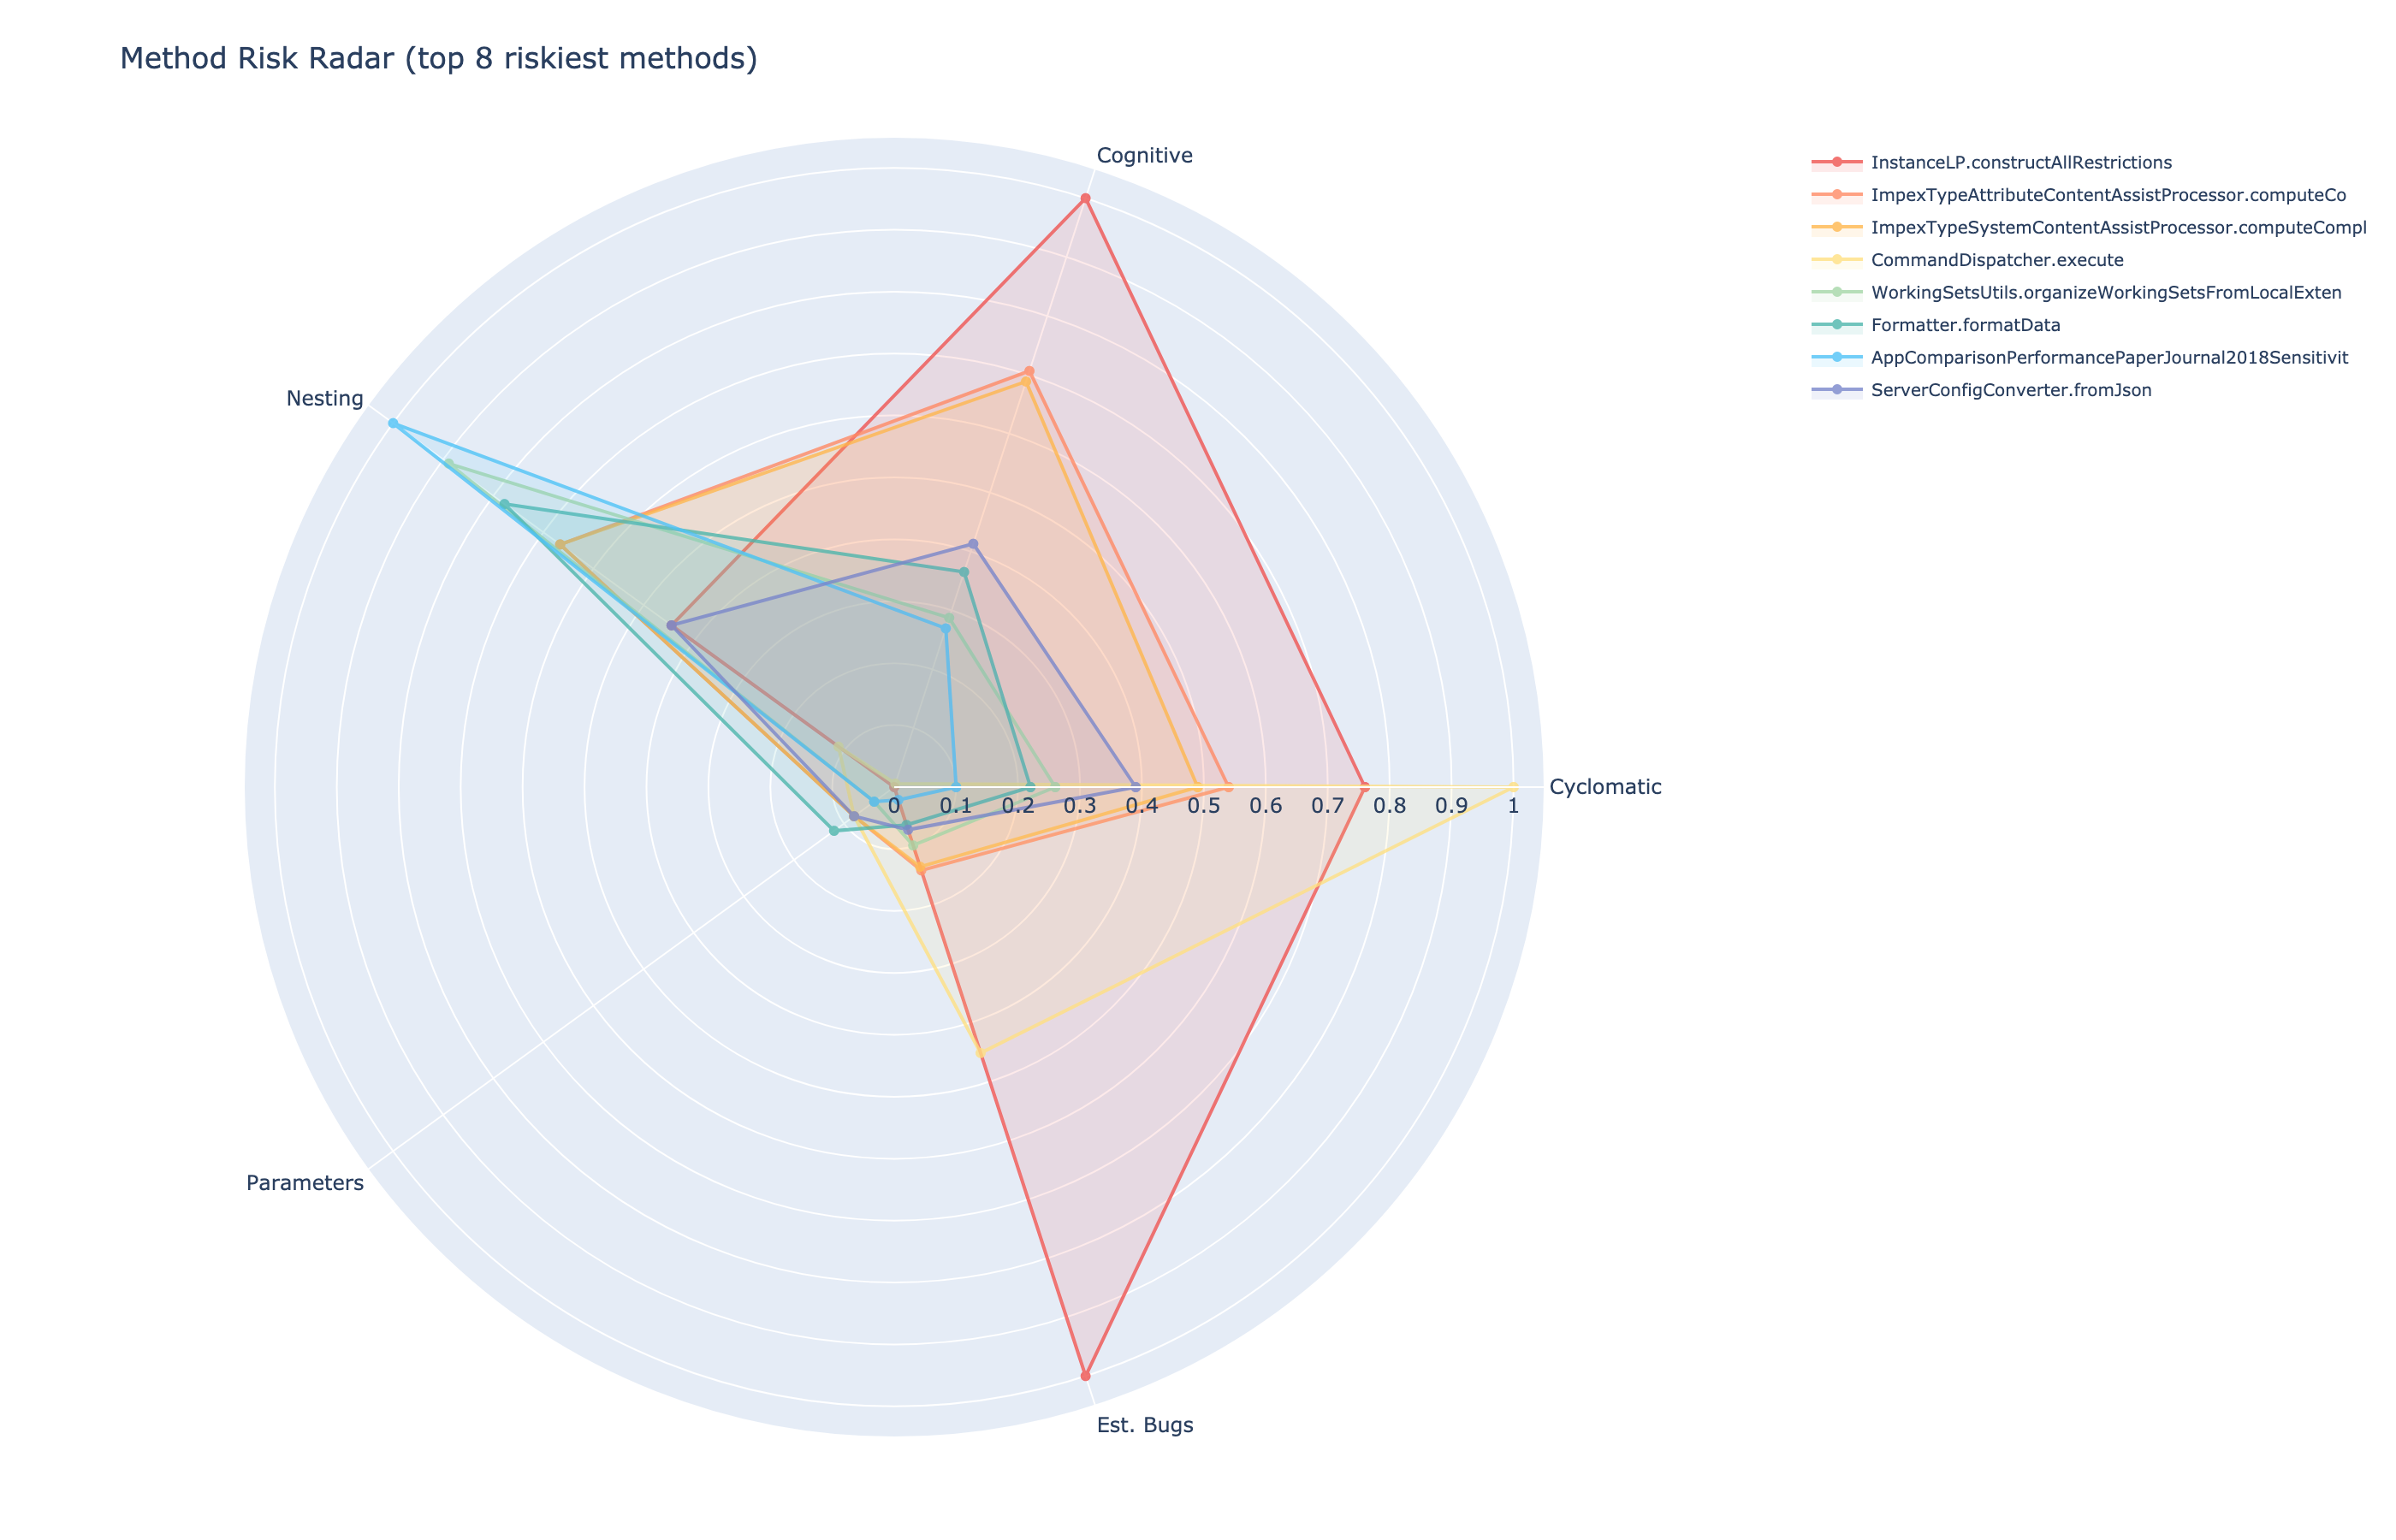
Radar chart: the riskiest methods spike on all 5 axes simultaneously: cyclomatic, cognitive, nesting, parameters, and estimated bugs.
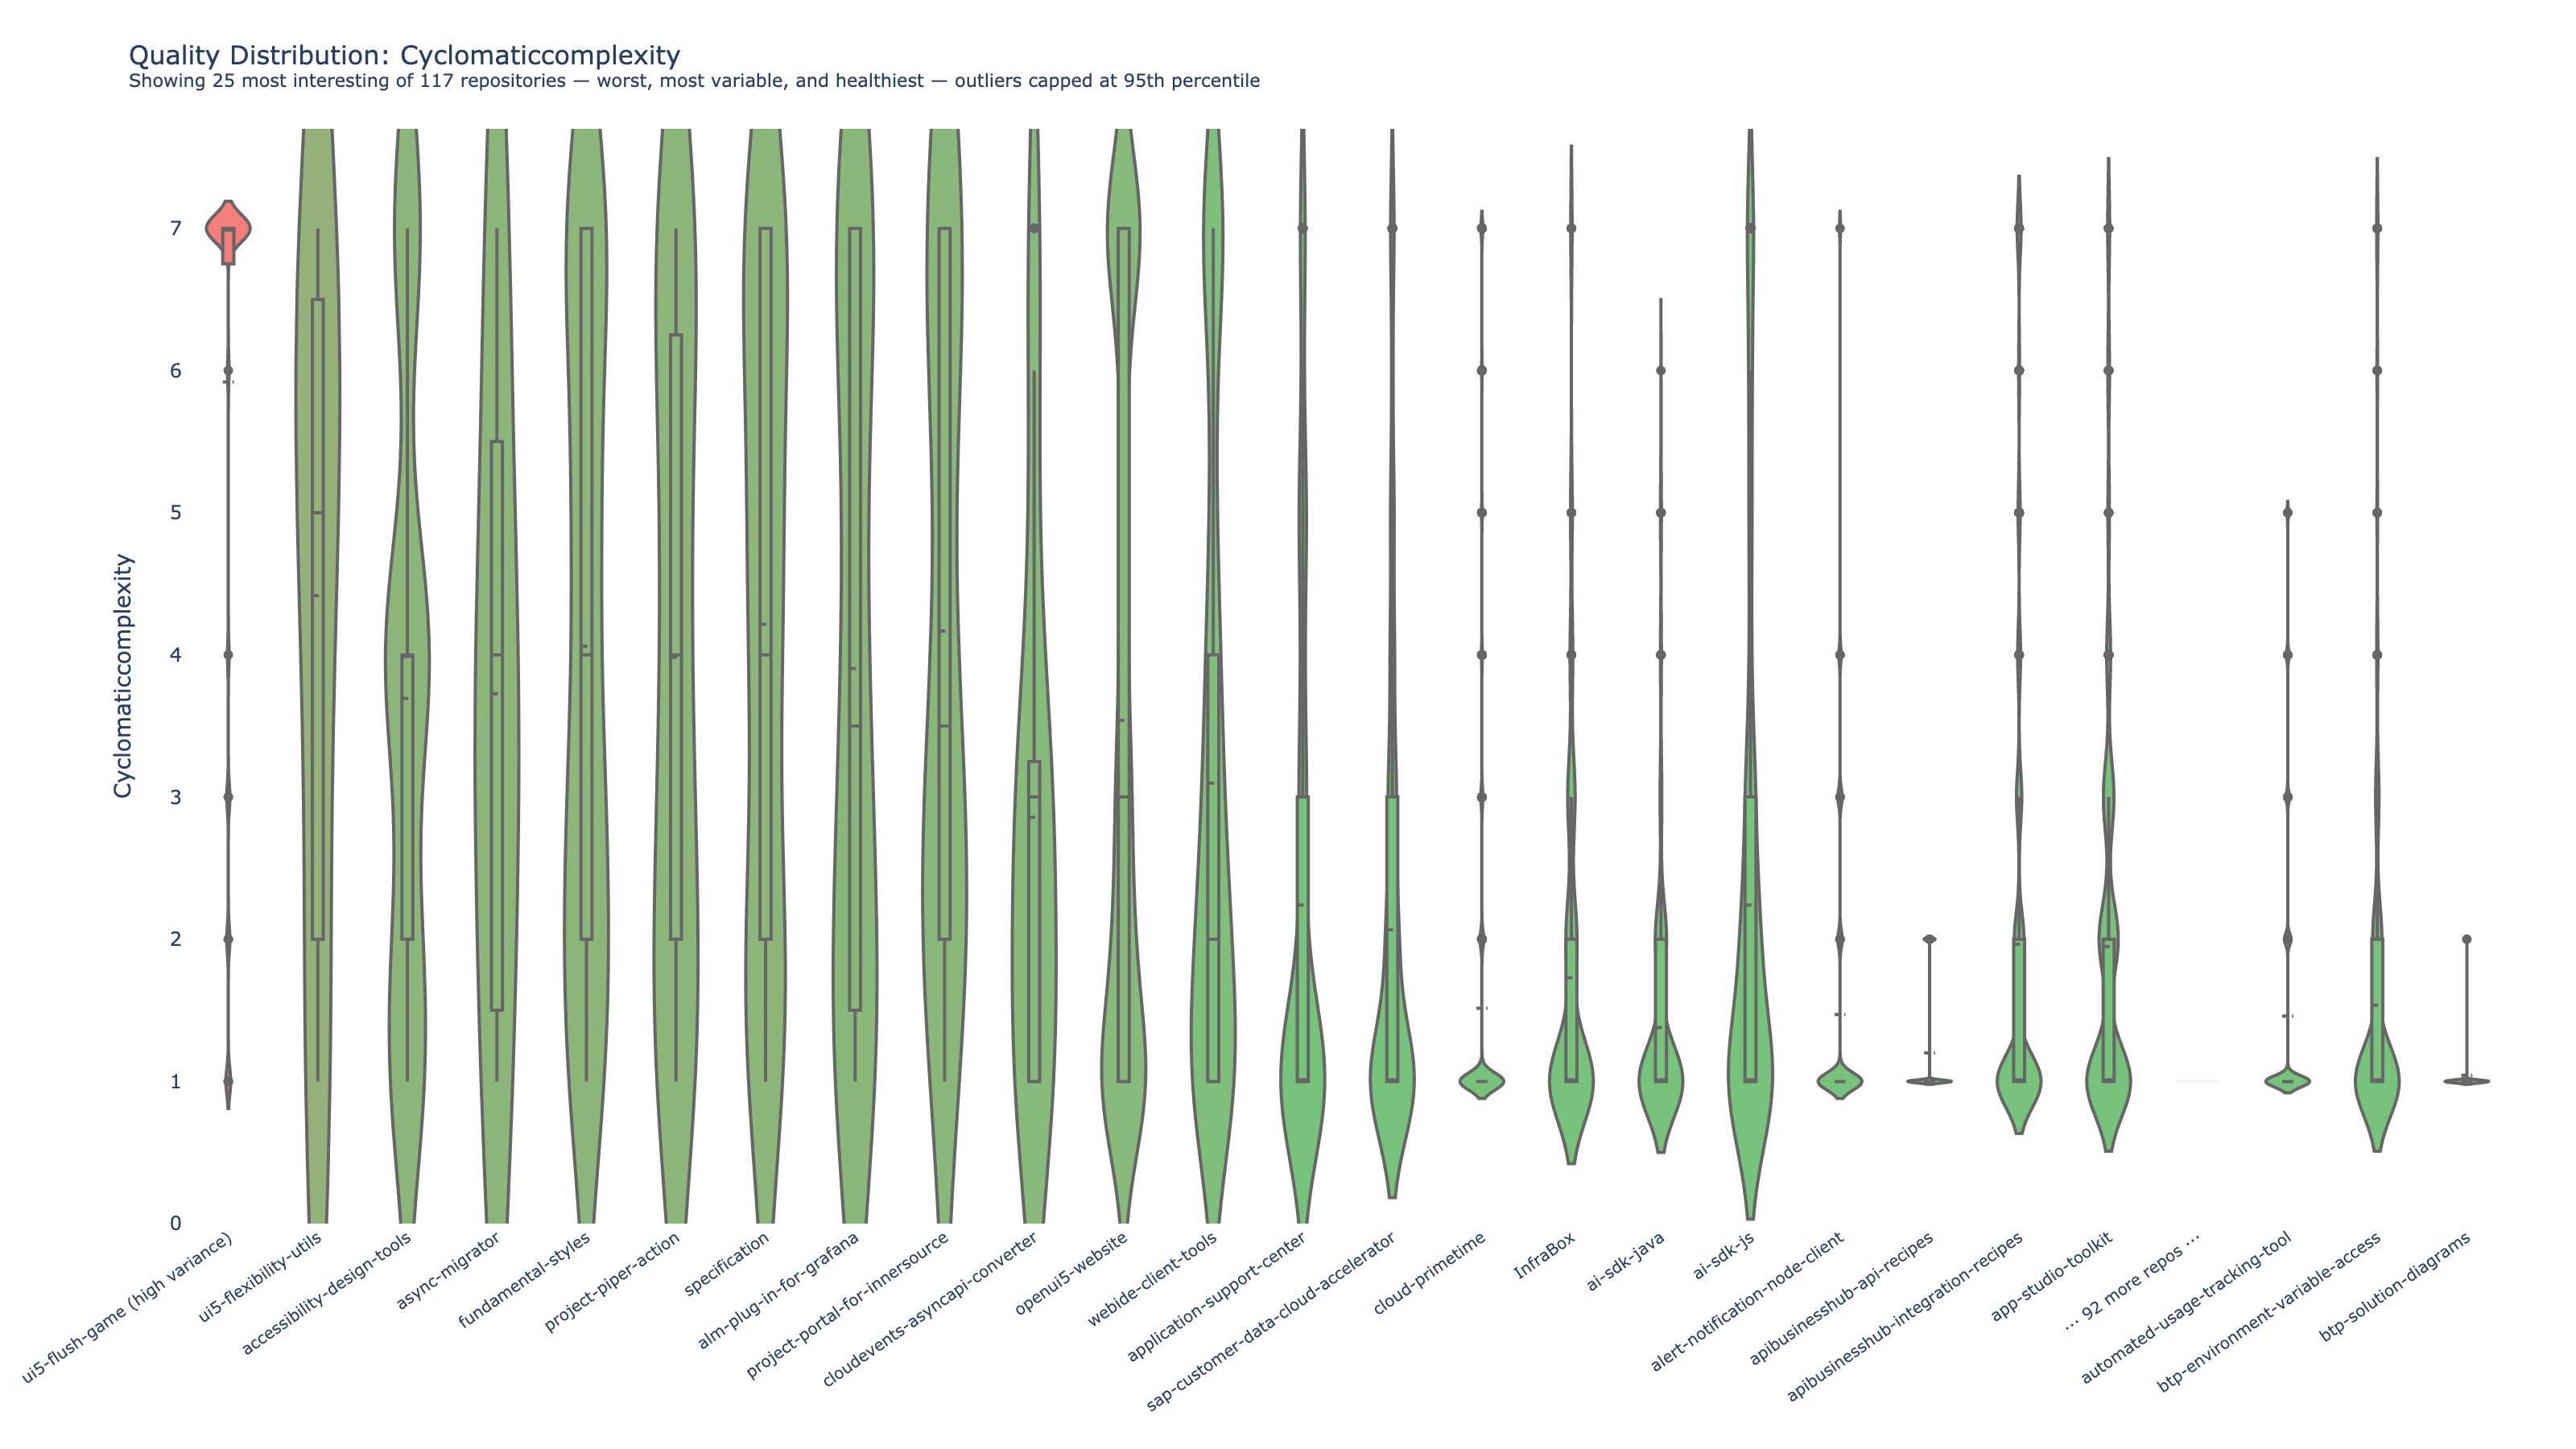
Violin plots: complexity distribution across repositories. The shape reveals outliers that averages hide.
Tight Class Cohesion (TCC)
TCC is a normalized cohesion measure: the proportion of method pairs that are directly connected through shared field access. TCC ranges from 0.0 (no pairs share fields) to 1.0 (every pair shares at least one field).
Where LCOM4 gives you an integer answer ("split into N"), TCC gives you a continuous score. A class with TCC of 0.8 is well-cohesive. A class with TCC of 0.05 is almost certainly doing too many unrelated things.
Coupling Between Objects (CBO)
CBO counts the number of distinct external classes that a class references, through field types, method parameters, return types, method invocations, and constructor calls.
High CBO means the class is tangled with many other classes. Changing it risks breaking things elsewhere. For an agent, high CBO is a signal to be careful, because changes to this class have a large blast radius.
Maintainability Index
The maintainability index is a composite score (0–100) combining Halstead volume, cyclomatic complexity, and lines of code. The formula was developed by Oman and Hagemeister in 1992 and adopted by Microsoft's Visual Studio. We use it as the "health score" in our portfolio visualization.
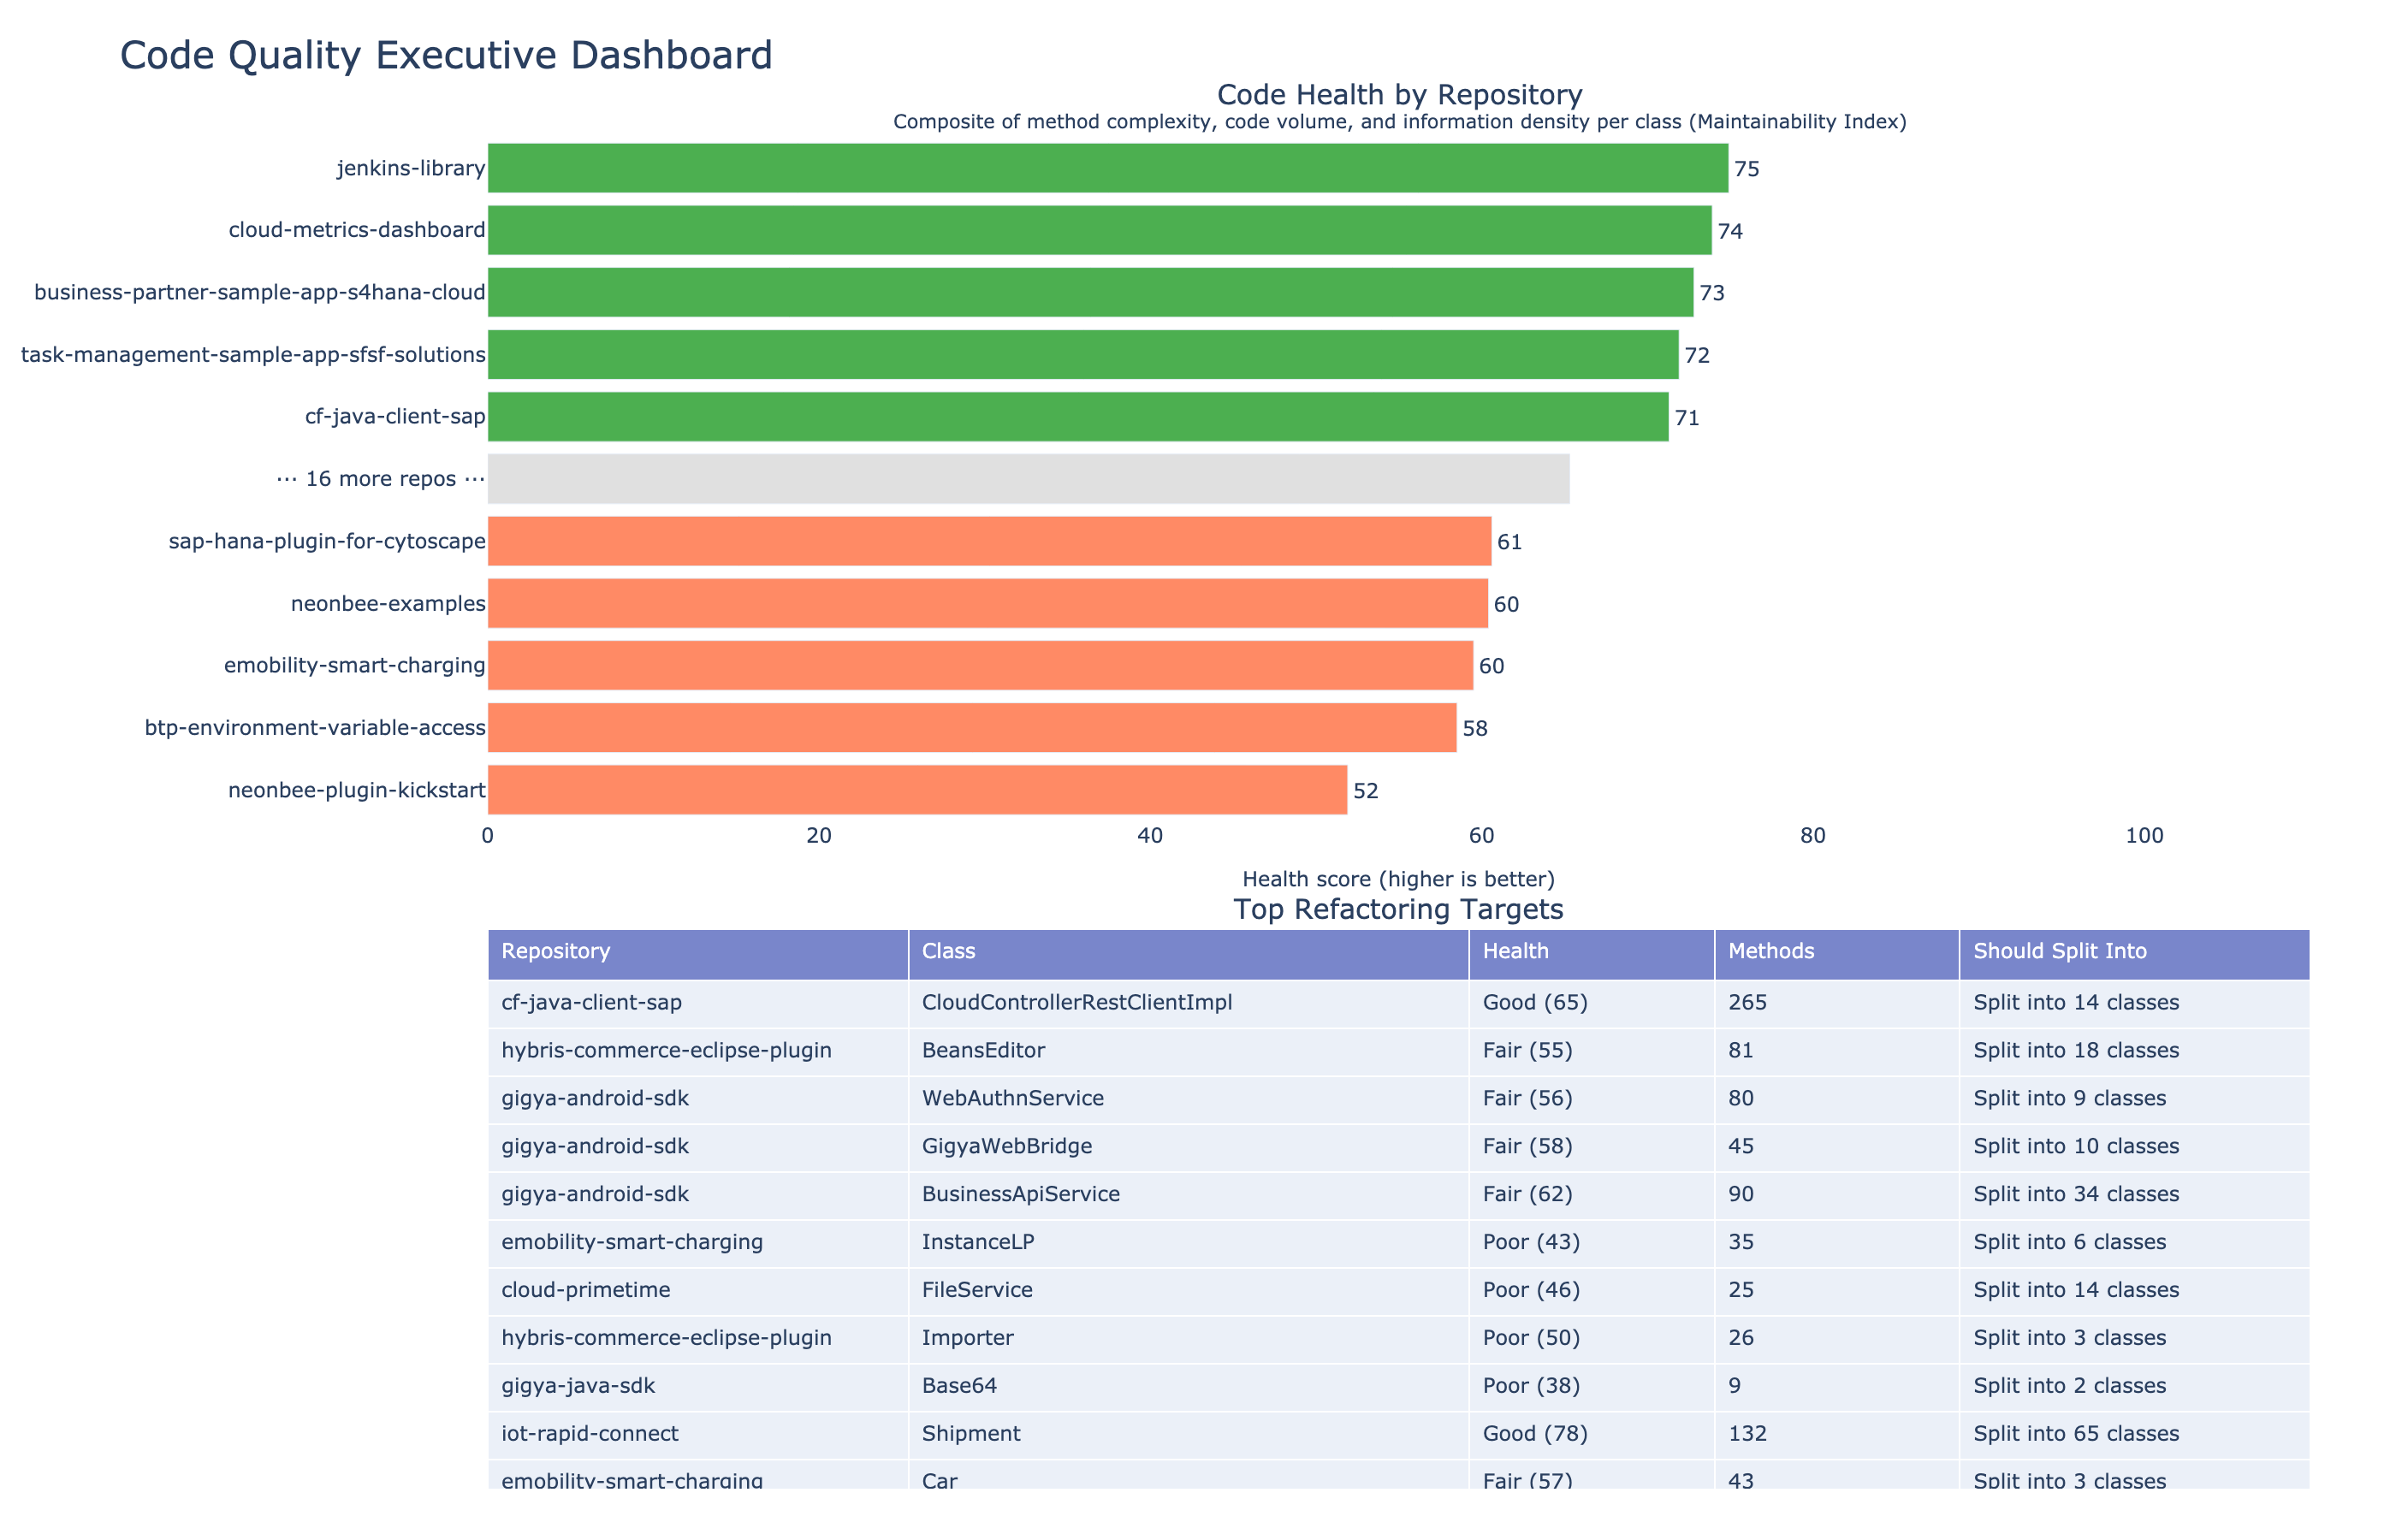
Executive dashboard: health scores across repositories in a large enterprise open source portfolio, 129 repos analyzed in a single run. Green bars are healthy. Red bars need attention. The bottom table shows top refactoring targets with actionable recommendations: "Split into 3 classes" or "Reduce complexity," derived directly from the metrics.
The Coupling-Cohesion Quadrant
The relationship between coupling (CBO) and cohesion (TCC) creates four natural categories of classes:
| Quadrant | Coupling | Cohesion | Meaning |
|---|
| Healthy | Low | High | Easy to change, well-designed |
| Spaghetti | High | Low | Tangled with everything and internally incoherent. The worst case. |
| Hub | High | High | Important and internally coherent, but fragile because many classes depend on it |
| Island | Low | Low | Isolated but messy inside. Low risk but could be cleaner. |
For an agent, the quadrant position tells it how to approach the class. Modifying a Hub requires caution. Modifying Spaghetti requires refactoring first. Modifying an Island is relatively safe.
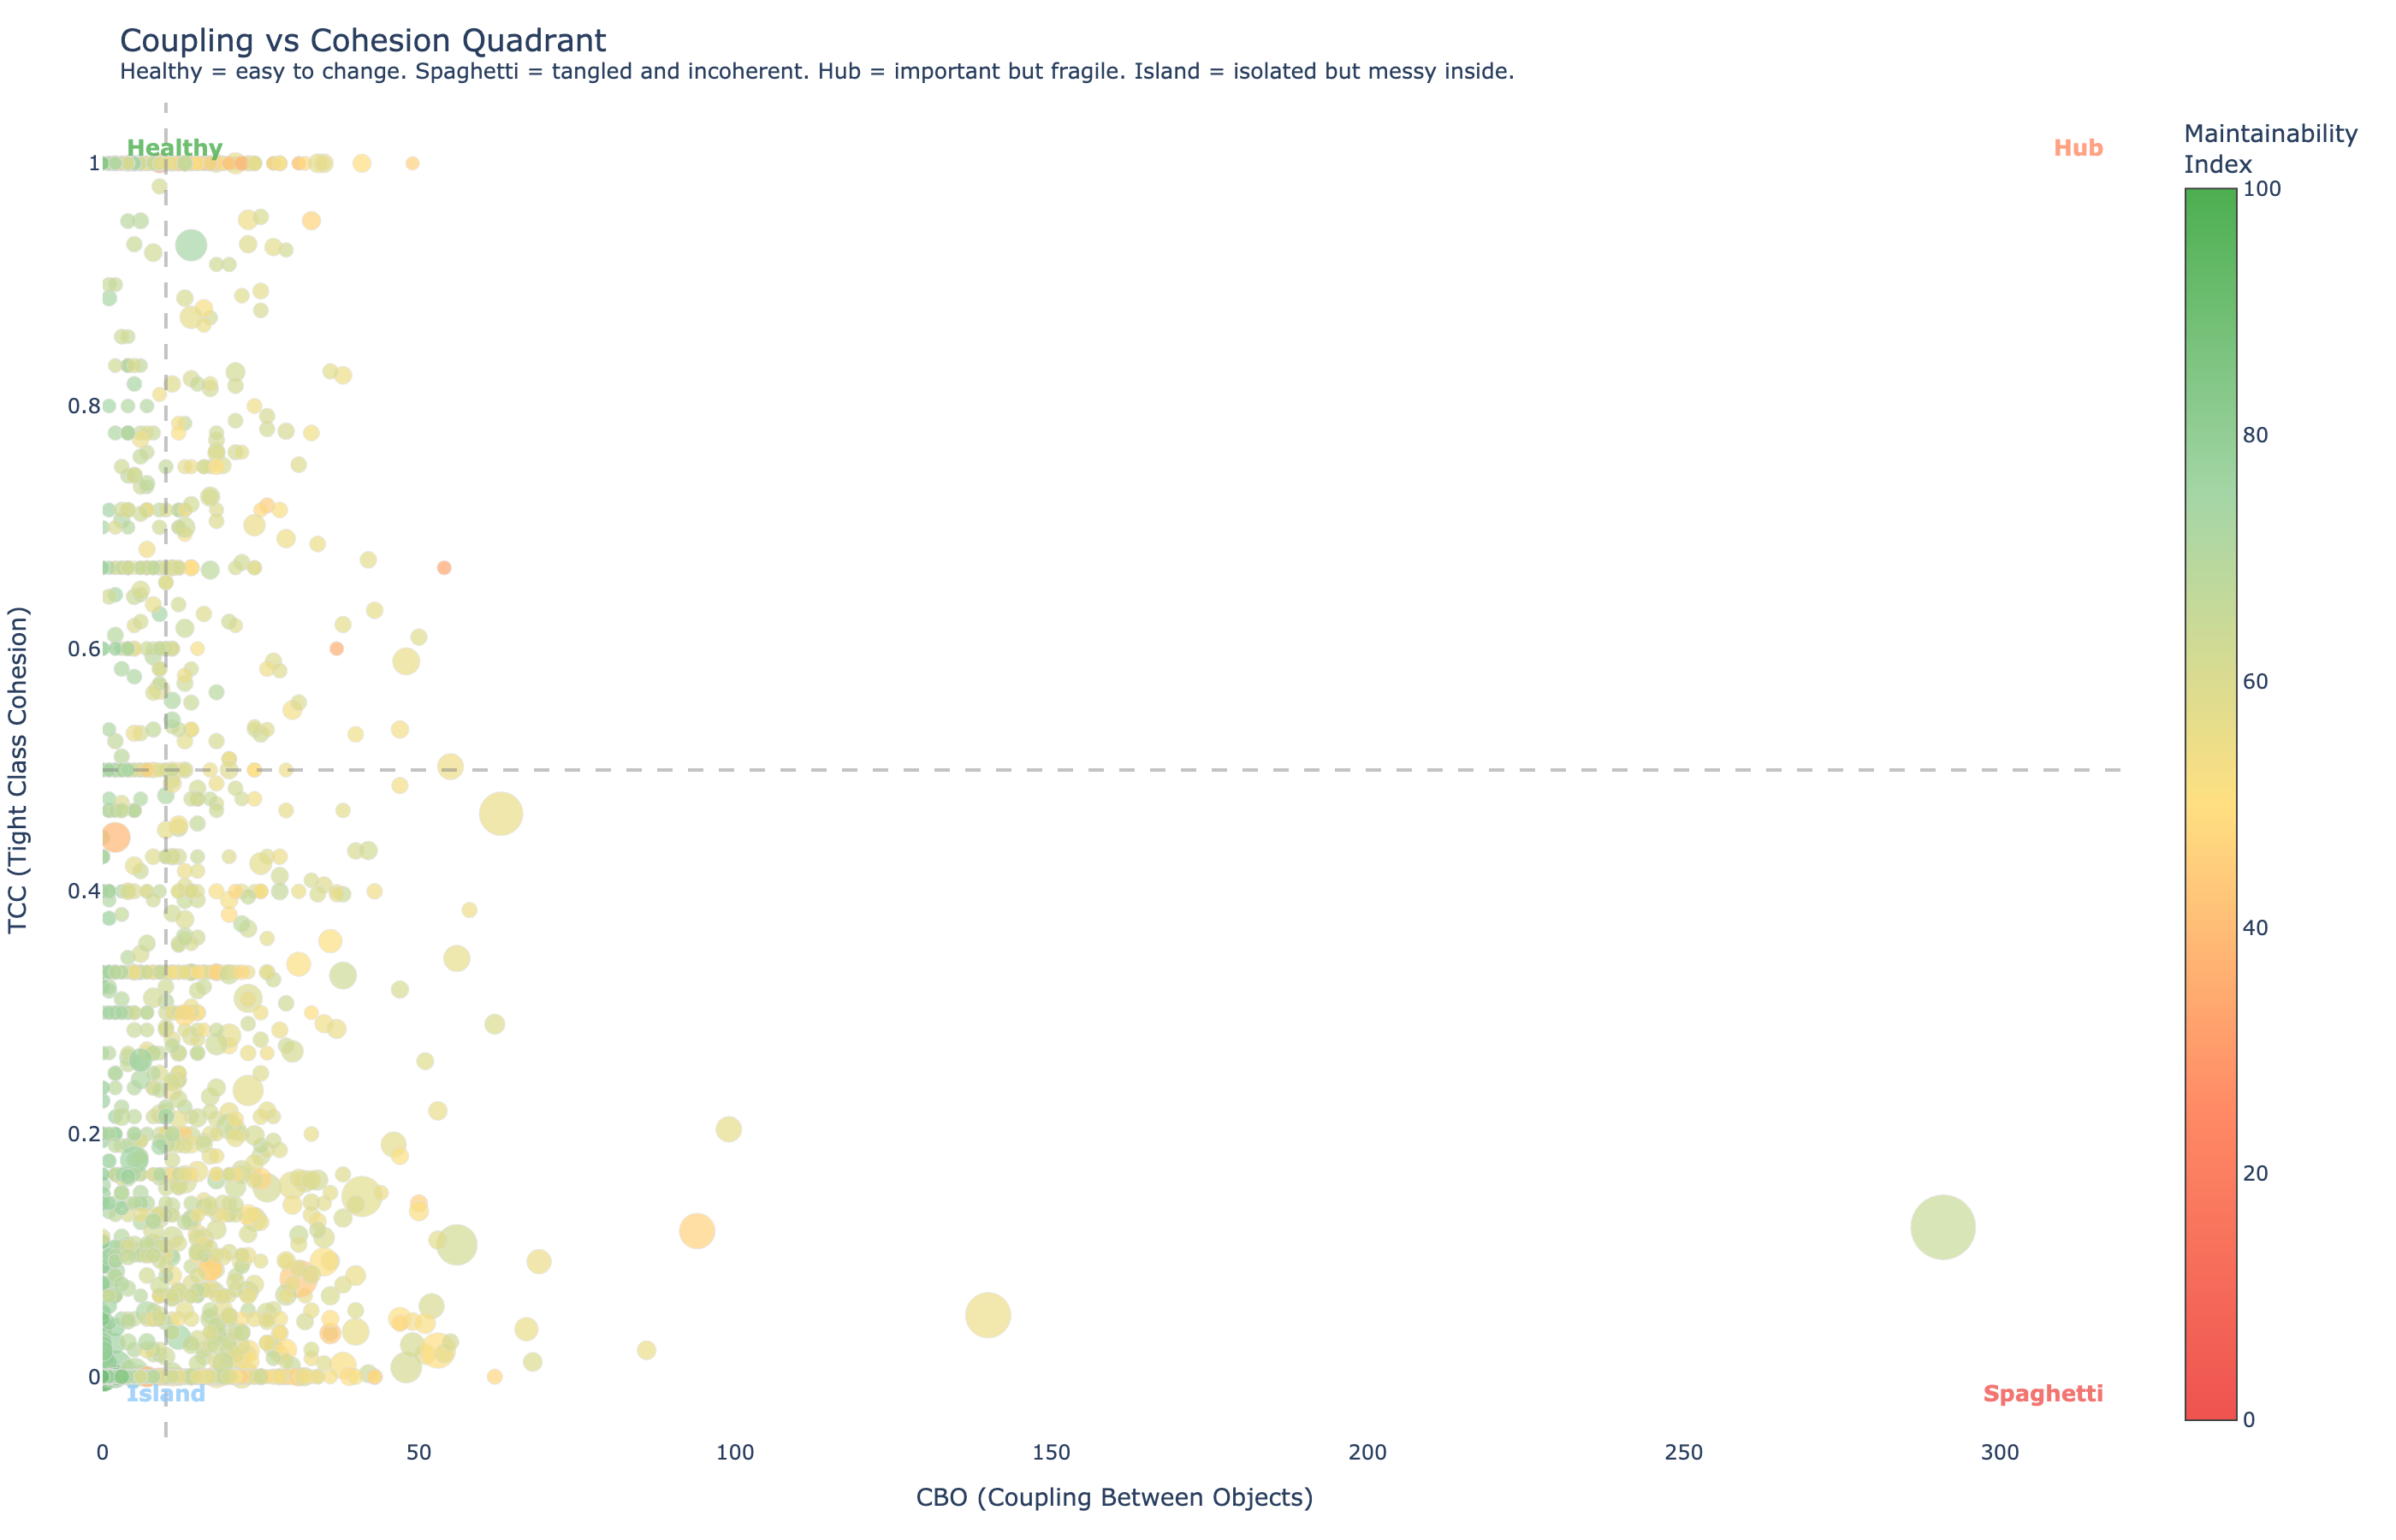
Coupling-Cohesion Quadrant: each dot is a class, positioned by its CBO (coupling) and TCC (cohesion). The quadrant position tells an agent how to approach modification. Spaghetti classes need refactoring before changes, Hubs need caution.
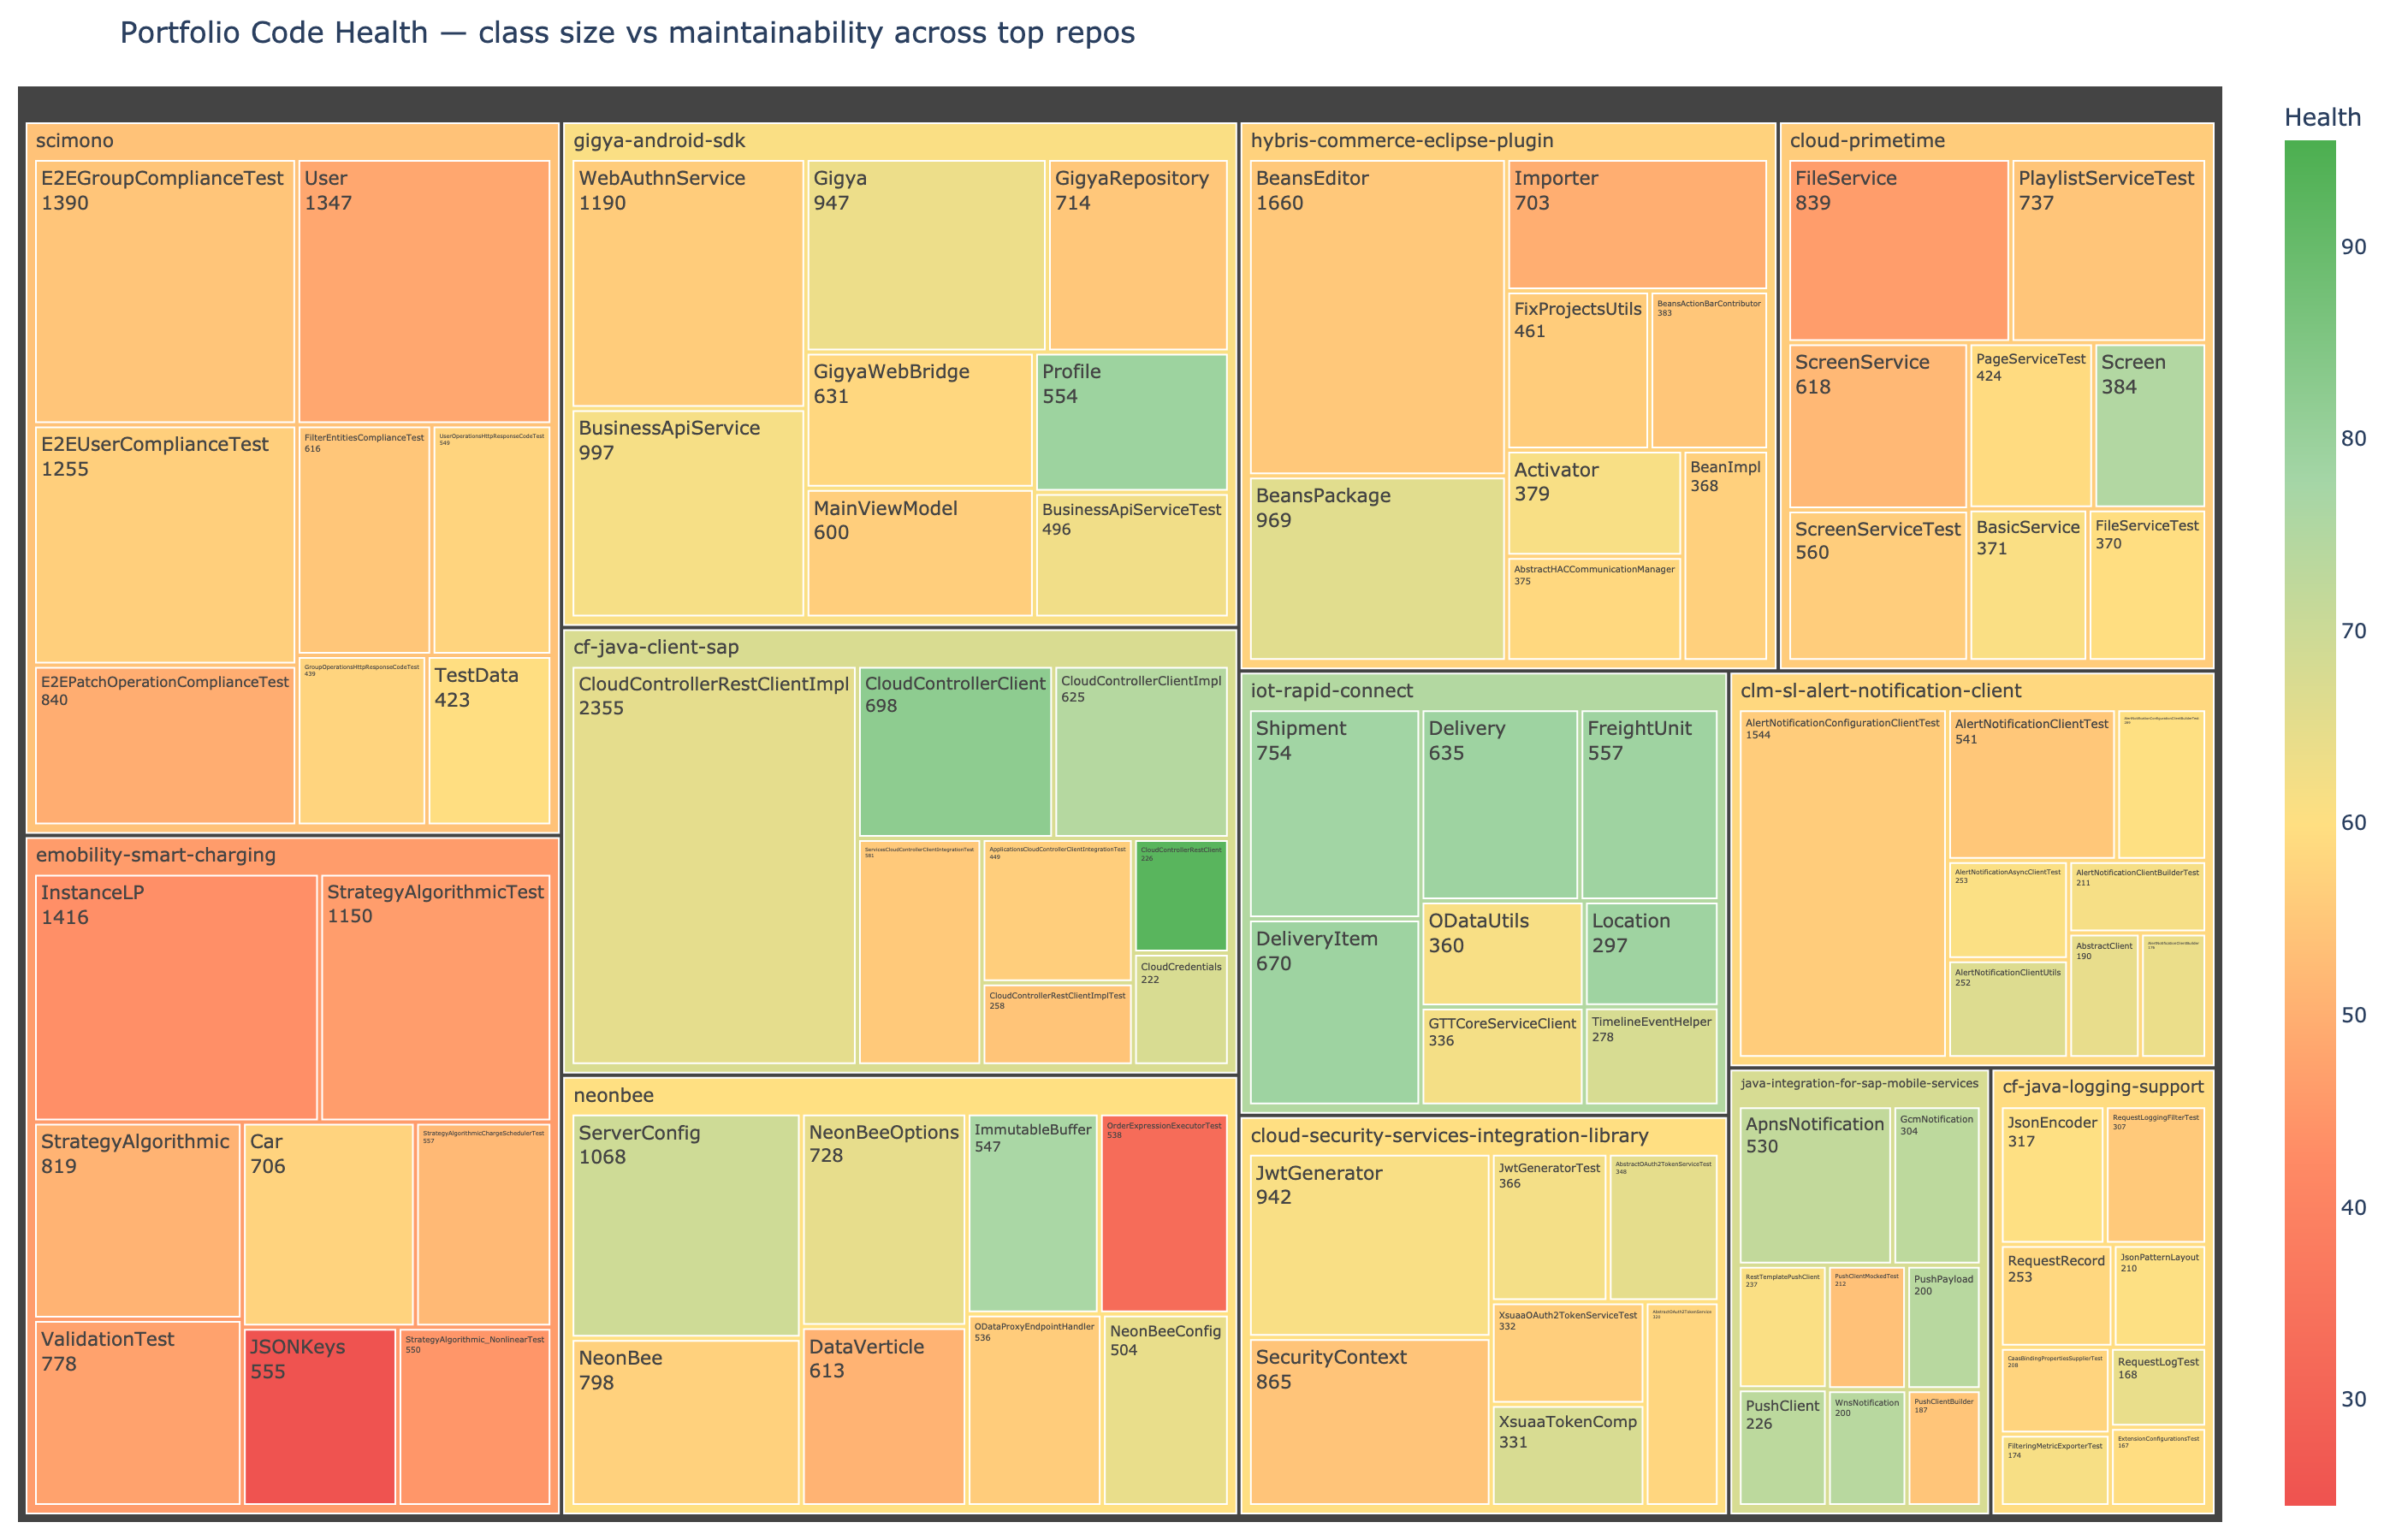
Portfolio health treemap: each block is a class, grouped by repository. Size = lines of code. Color = maintainability index (green = healthy, red = needs attention). The largest, reddest blocks are the highest-priority refactoring targets.
Package Architecture Metrics
Individual classes exist within packages, and the relationships between packages define the architecture. Prethink computes package-level metrics that surface architectural decay.
Afferent and Efferent Coupling
Afferent coupling (Ca) counts how many other packages depend on this one. Efferent coupling (Ce) counts how many packages this one depends on.
Instability
Instability = Ce / (Ca + Ce)
A package with instability 0.0 is maximally stable: many things depend on it, it depends on nothing. A package with instability 1.0 is maximally unstable: it depends on everything, nothing depends on it.
Abstractness and Robert Martin's Main Sequence
The stability-abstractness diagram is a classic software architecture metric that visualizes package health. Each package is plotted by its instability (x-axis) and abstractness (y-axis, ratio of abstract classes to total classes). The ideal line, the "main sequence," is A + I = 1.
Zone of Pain
Packages near (0, 0), stable but fully concrete. They're hard to change because many things depend on them, but they have no abstractions to extend.
Zone of Uselessness
Packages near (1, 1), unstable but fully abstract. They're abstract interfaces nobody implements.
Dependency Cycle Detection
The star markers in the stability chart indicate packages that are part of dependency cycles, circular dependencies between packages, that make independent deployment and testing impossible. Prethink uses Tarjan's strongly connected components algorithm to detect these.
Real finding: 45% of packages in cycles
In a run across a large enterprise open source portfolio (129 repositories), 233 out of 514 packages were in dependency cycles. That's 45% of the package structure with circular dependencies. These are the architectural tangles that make it impossible to change one package without recompiling half the system.
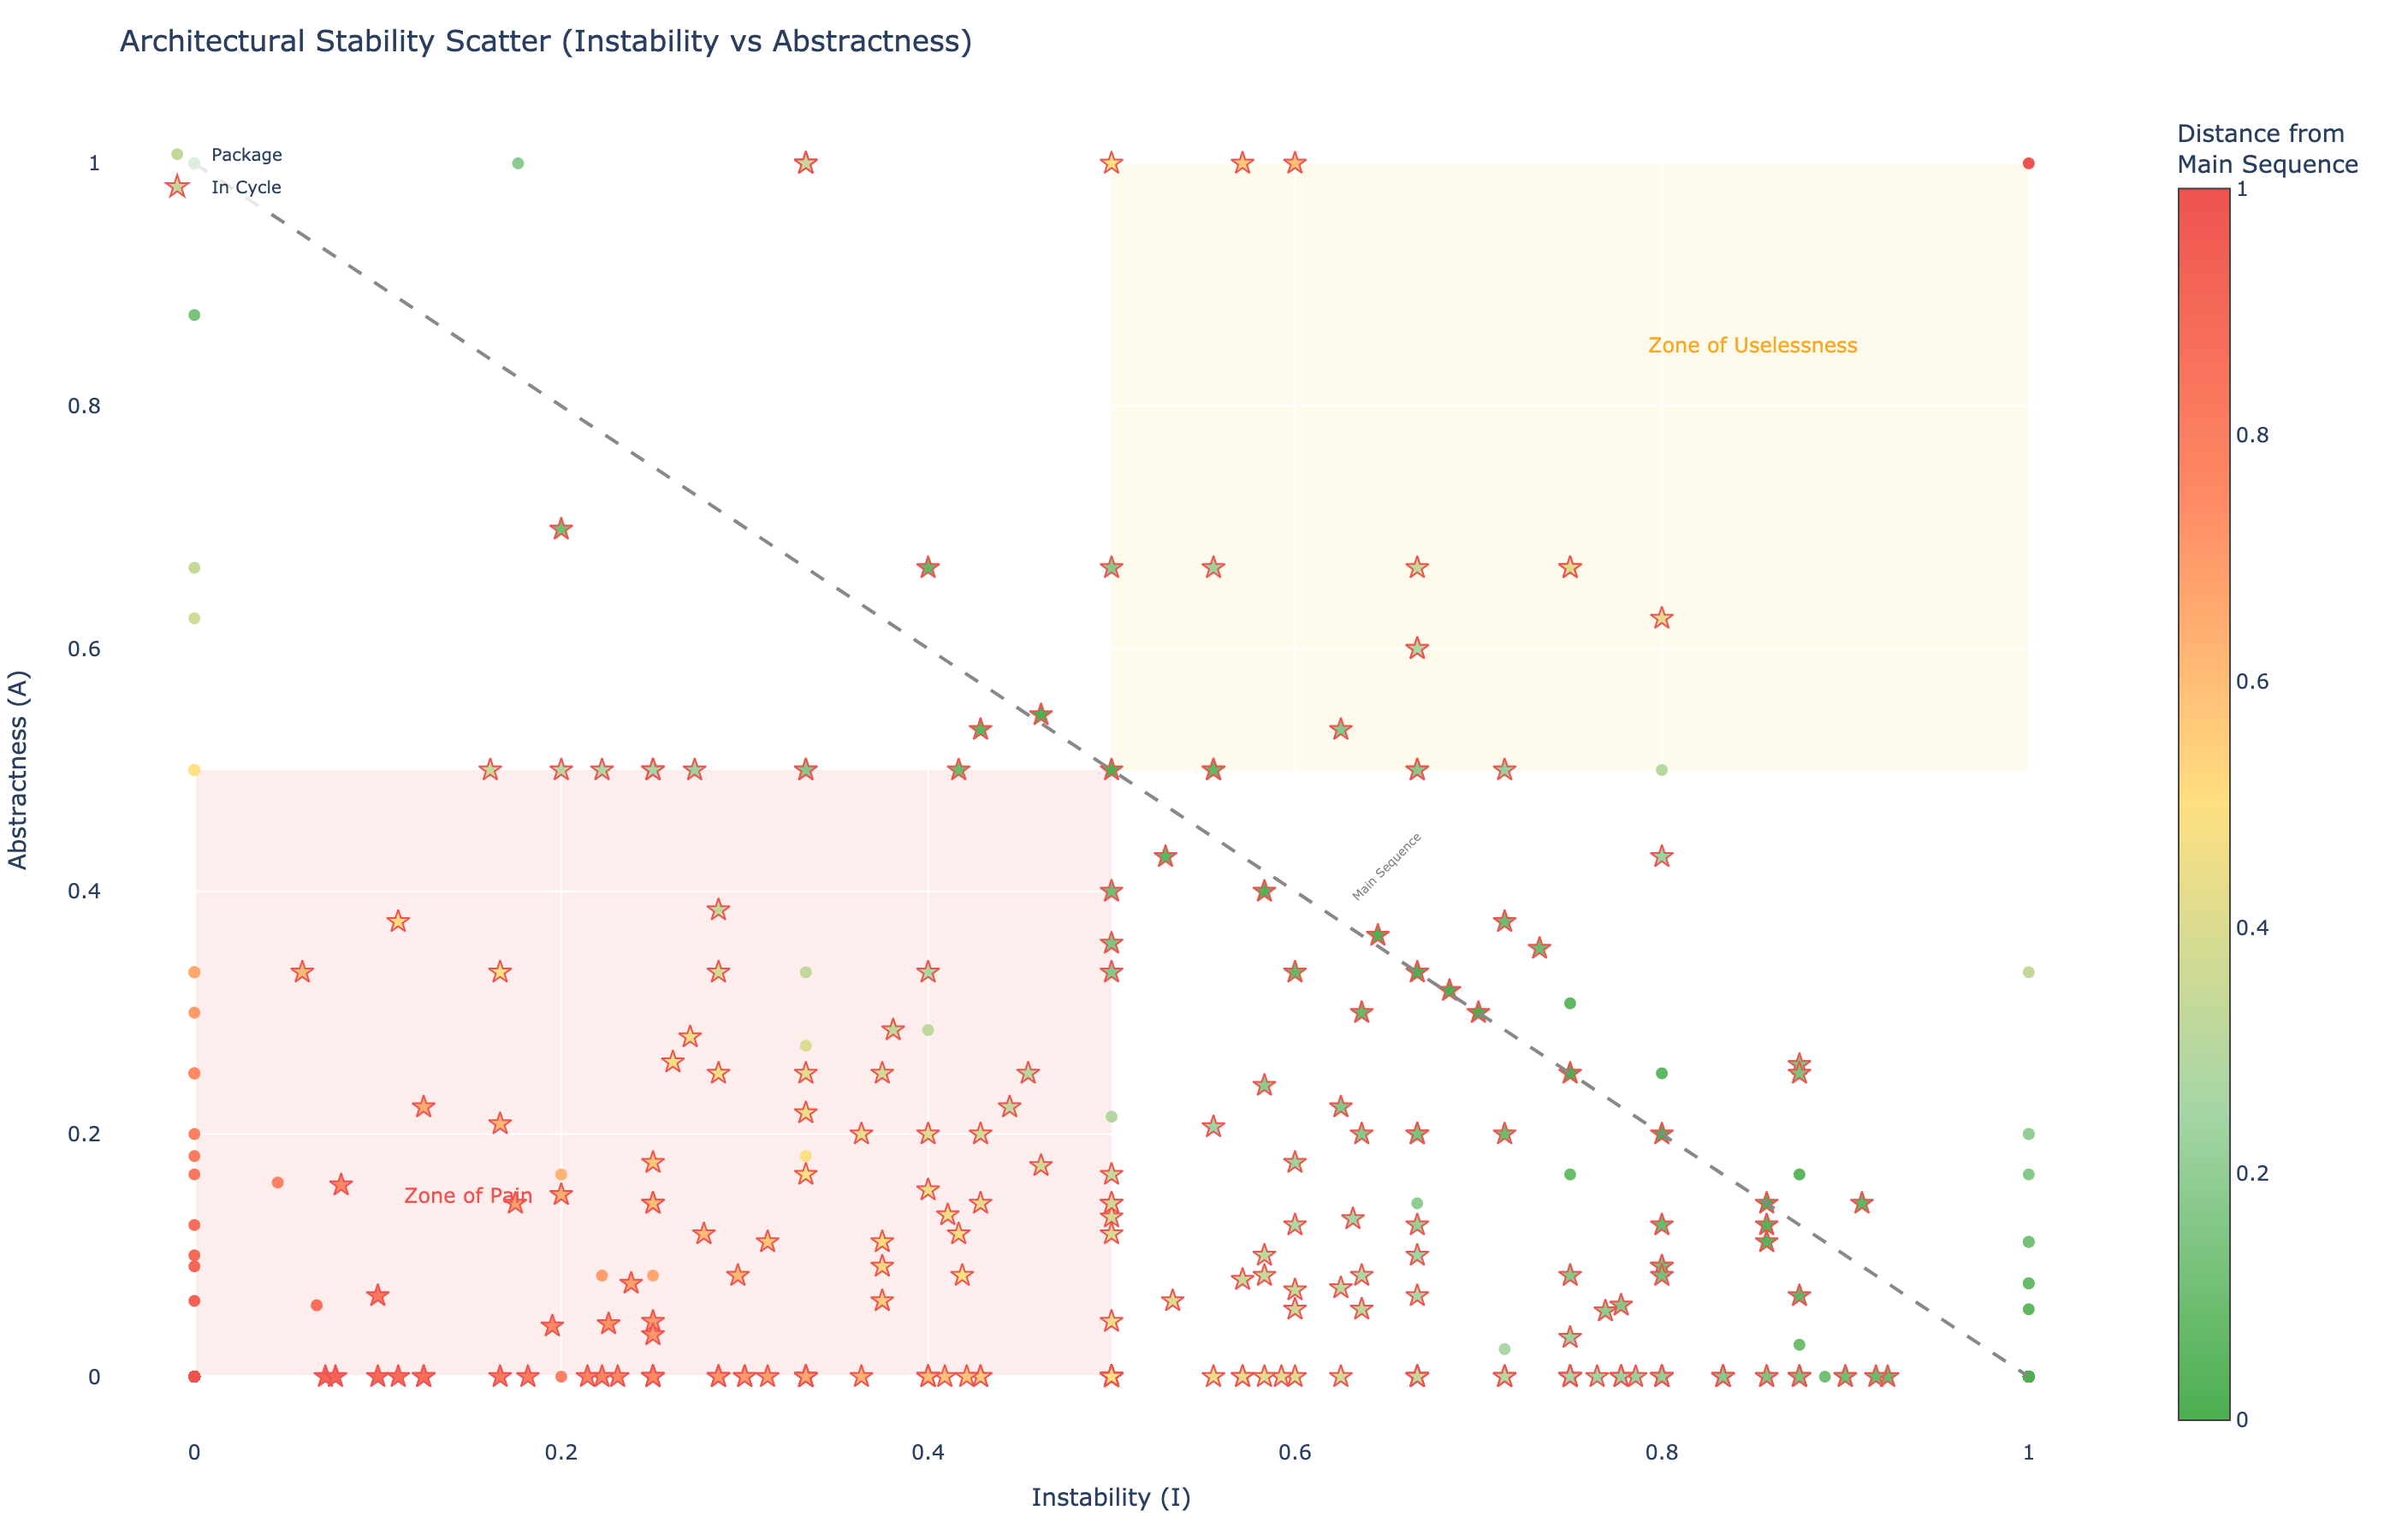
Stability-Abstractness diagram: each point is a package. The diagonal "main sequence" line represents the ideal balance. Star markers indicate packages caught in dependency cycles. Packages in the lower-left Zone of Pain are the most architecturally risky.
Code Smell Detection
Individual metrics are useful. But the real power comes from combining them into composite thresholds that detect specific design problems.
God Class Critical
A God Class has accumulated too many responsibilities. The detection uses three metrics simultaneously:
- WMC ≥ 47: high weighted complexity
- TCC < 0.33: low cohesion (methods don't share state)
- ATFD > 5: accesses more than 5 foreign data attributes
When all three conditions are met, the class is flagged with a severity based on how far the values exceed the thresholds.
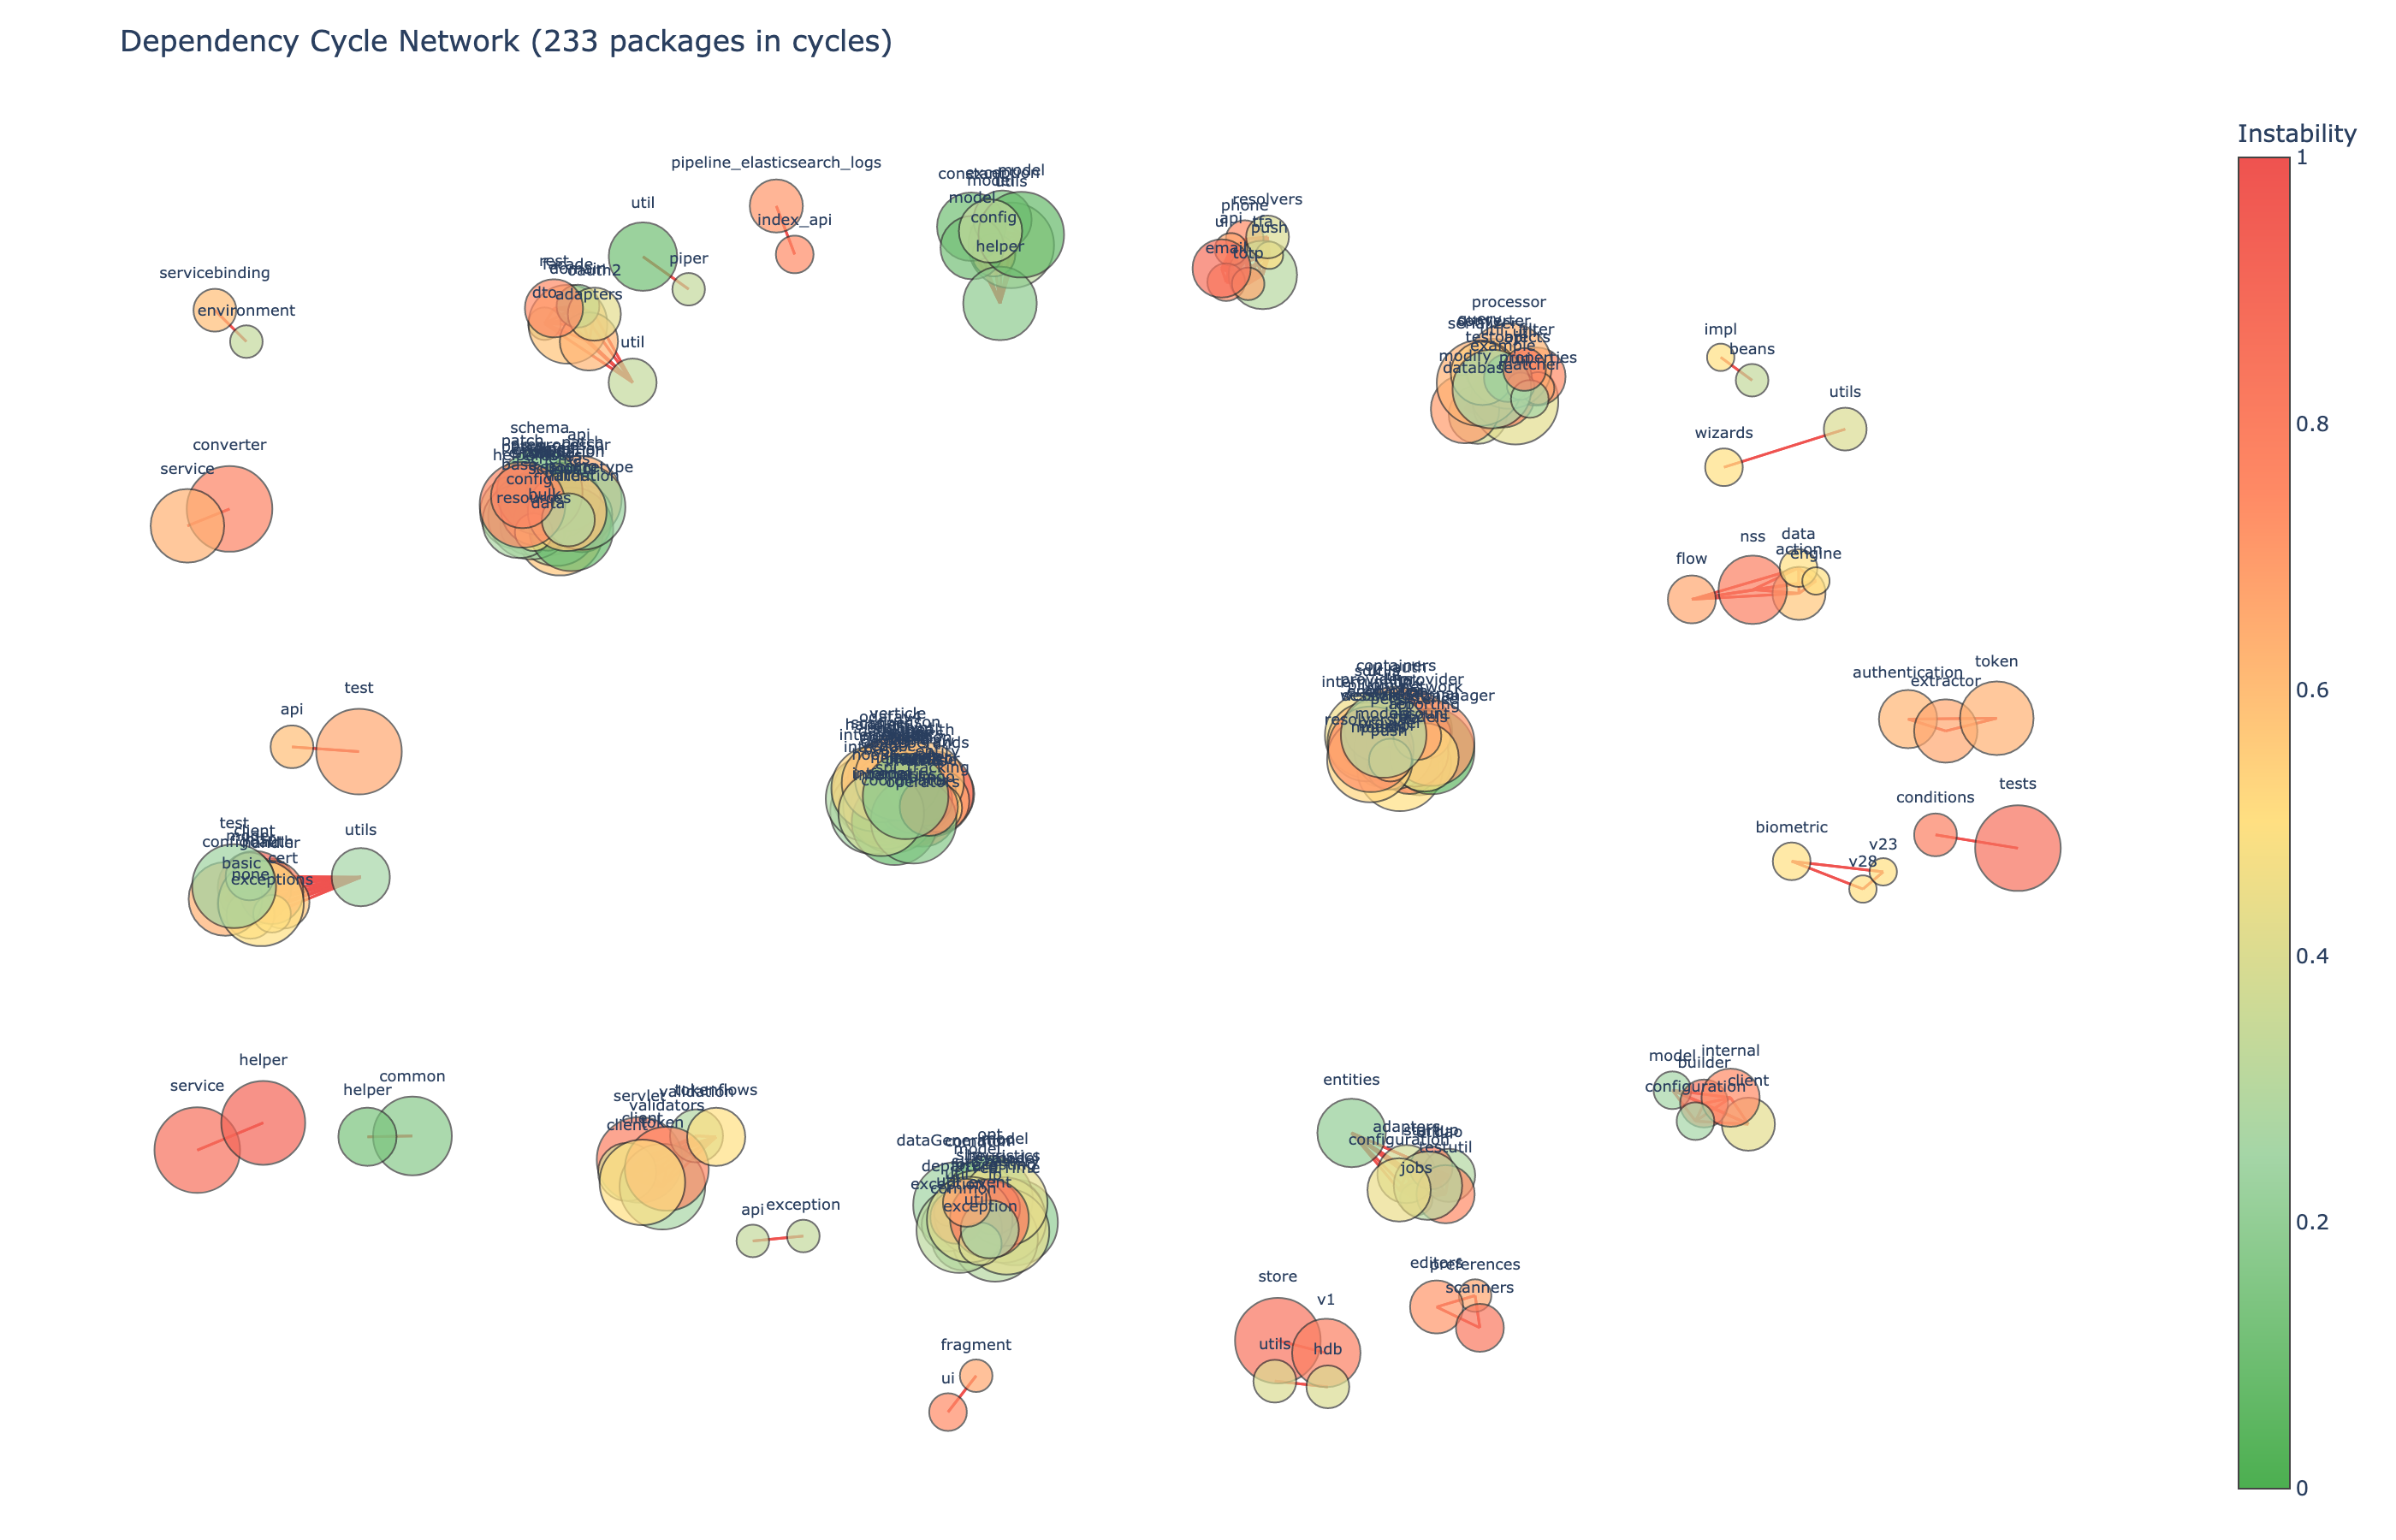
Network graph: red edges are cycle dependencies. Node size reflects total coupling. 233 of 514 packages form cycles.
Worst finding: WMC = 339
One class in the portfolio, a REST client implementation, hit WMC=339 with minimal cohesion, CRITICAL severity. It was handling dozens of unrelated REST operations in a single class. This is the kind of finding that should block an agent from adding more methods to the class.
Feature Envy
A method exhibits Feature Envy when it uses more features of other classes than its own. Prethink flags Feature Envy when:
- Foreign accesses ≥ 5
- Foreign accesses > 2x own accesses
This metric tells an agent: "this method is in the wrong class." The fix is usually a Move Method refactoring: move the method to the class whose data it primarily uses.
Data Class
A Data Class contains only fields and getters/setters with no meaningful behavior. Prethink detects these when more than 2/3 of methods are getters/setters and the behavioral WMC (excluding accessors) is ≤ 3.
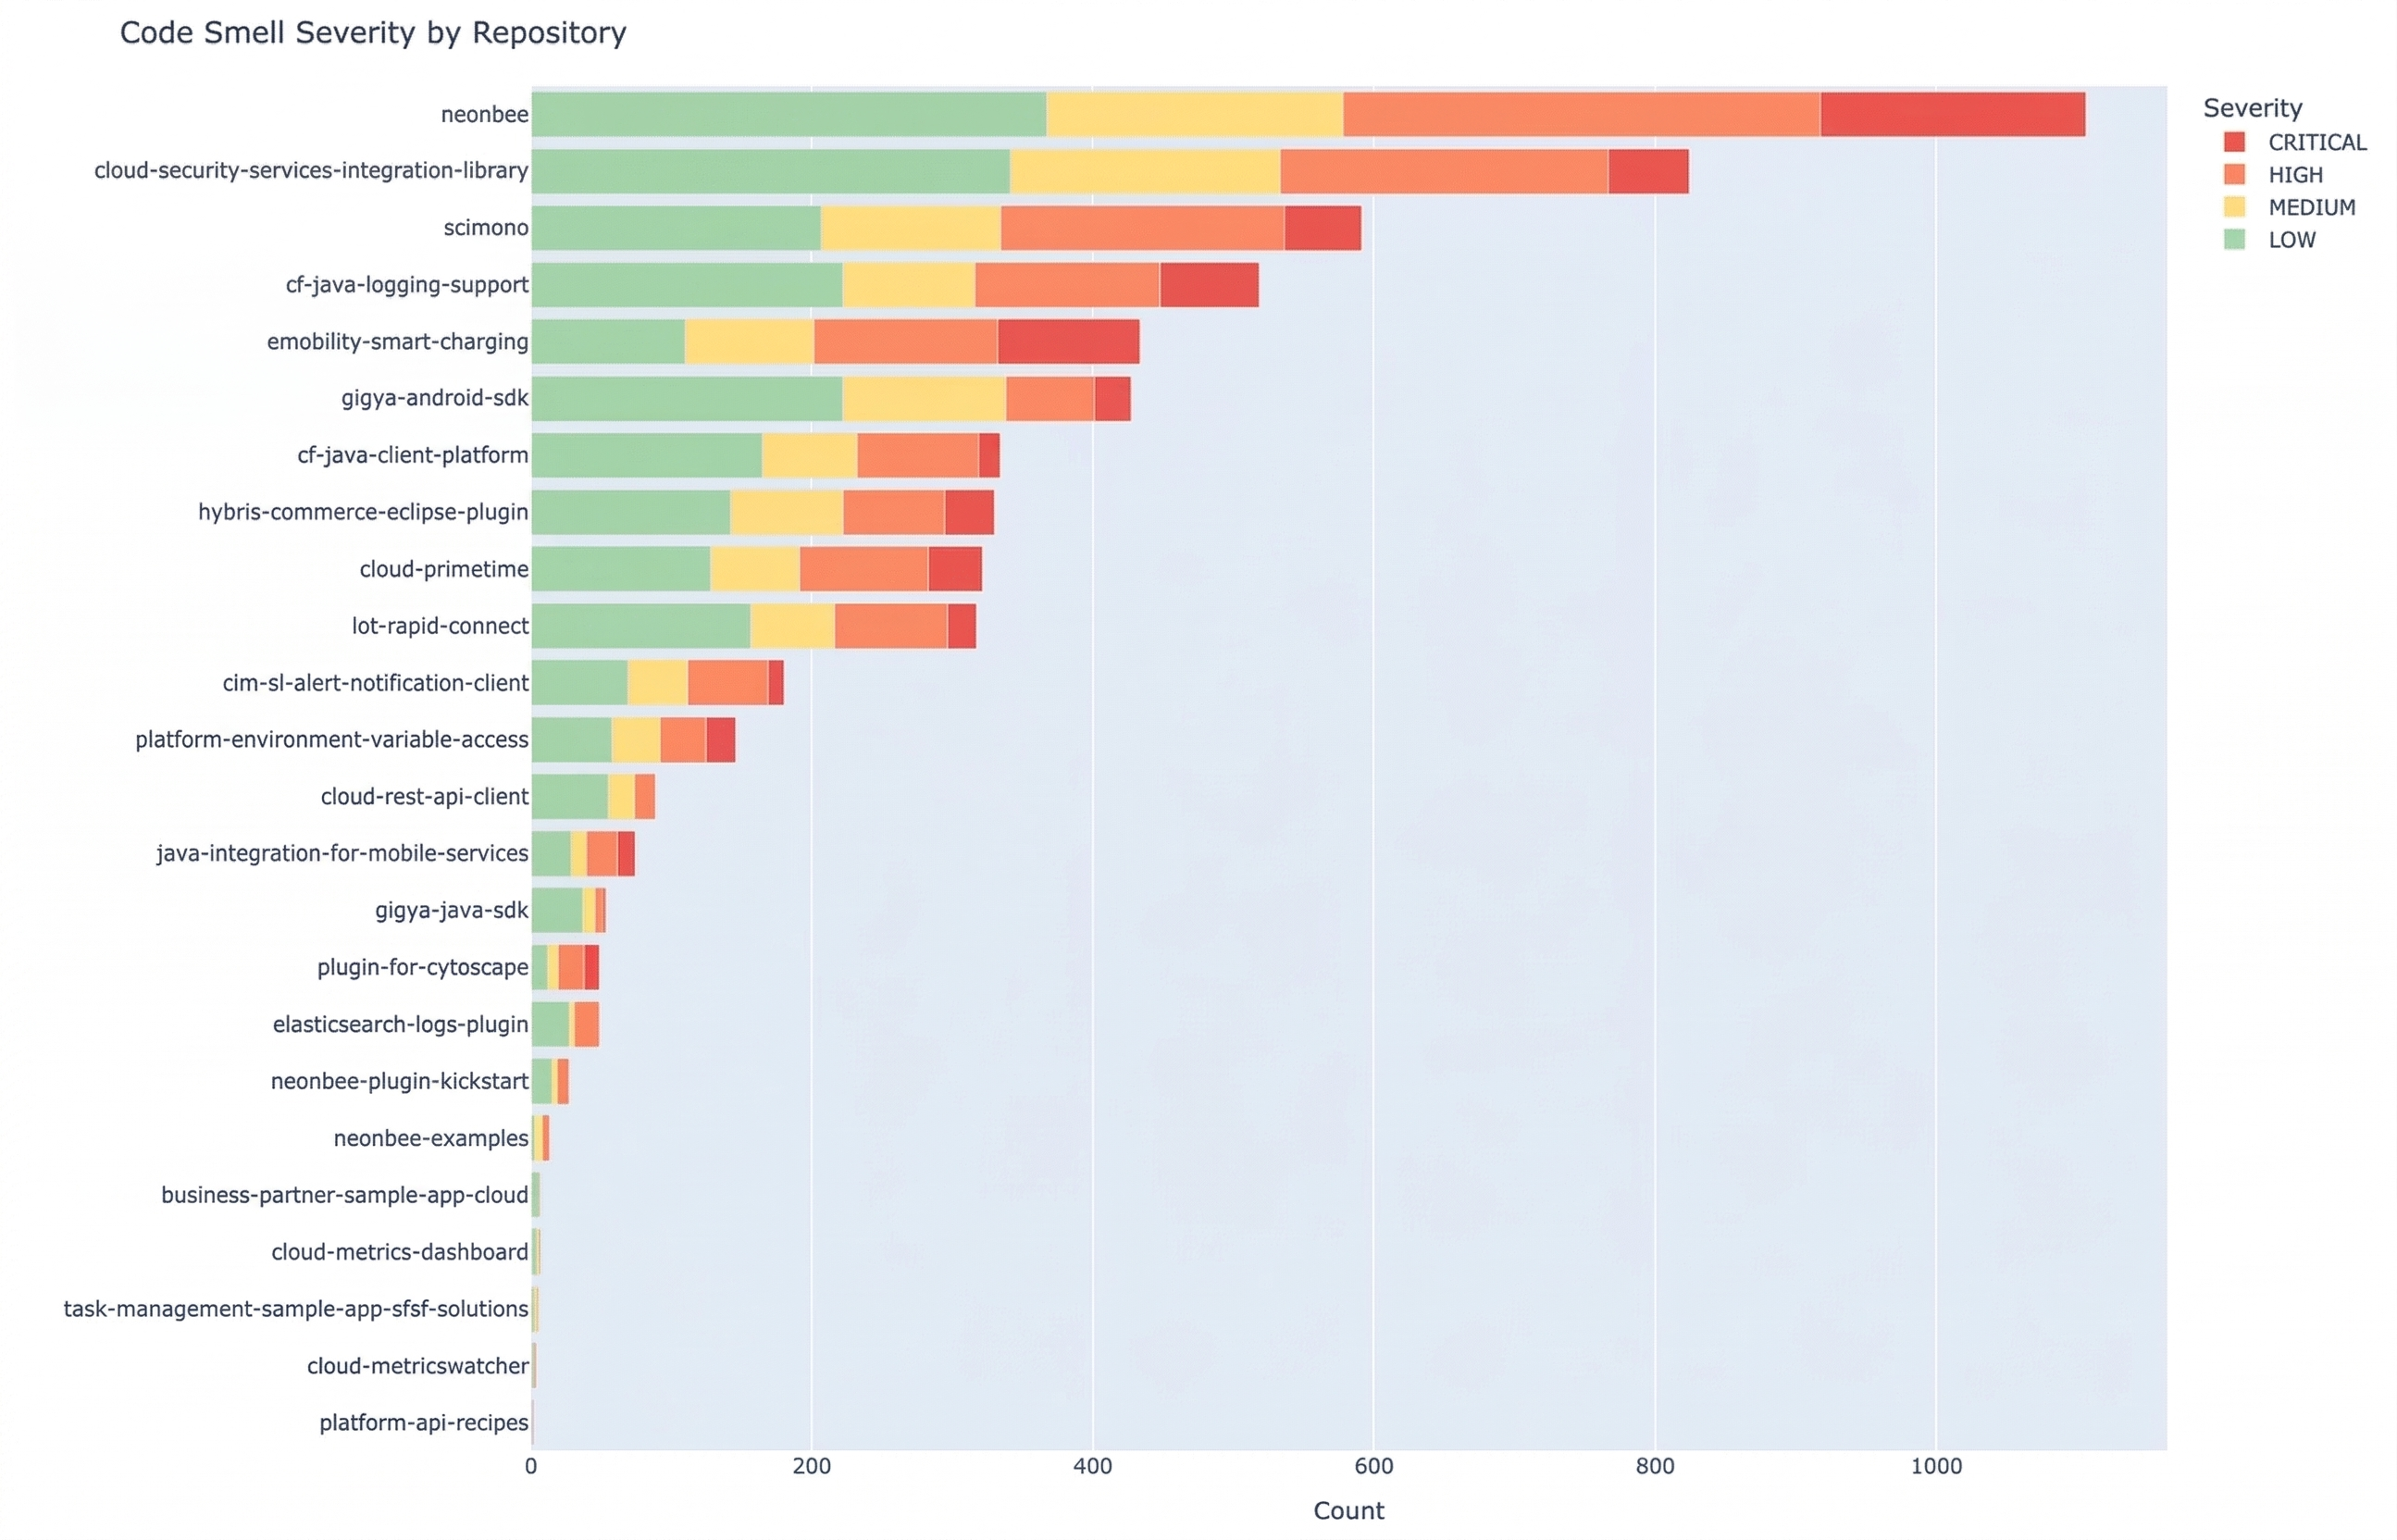
Stacked bar: smell counts per repository, segmented by severity (critical → low).
Data classes often indicate an anemic domain model. An agent encountering a Data Class should consider whether the behavior that operates on its data (likely in another class exhibiting Feature Envy) should be moved into the Data Class itself.
Test Gap Analysis
Test gap analysis is the inverse of test coverage mapping. Instead of showing what is tested, it shows what isn't, and ranks the gaps by risk.
The risk score combines two signals:
riskScore = cyclomaticComplexity × (1 + callCount)
525
LoggingUtil.debug
risk score
312
LoggingUtil.error
risk score
264
TypeVisitorOperand
.setType risk score
A method with a risk score of 525, a heavily-called logging utility in one enterprise portfolio, with branching logic and no tests. If an agent modifies it and introduces a bug, hundreds of call sites are affected.
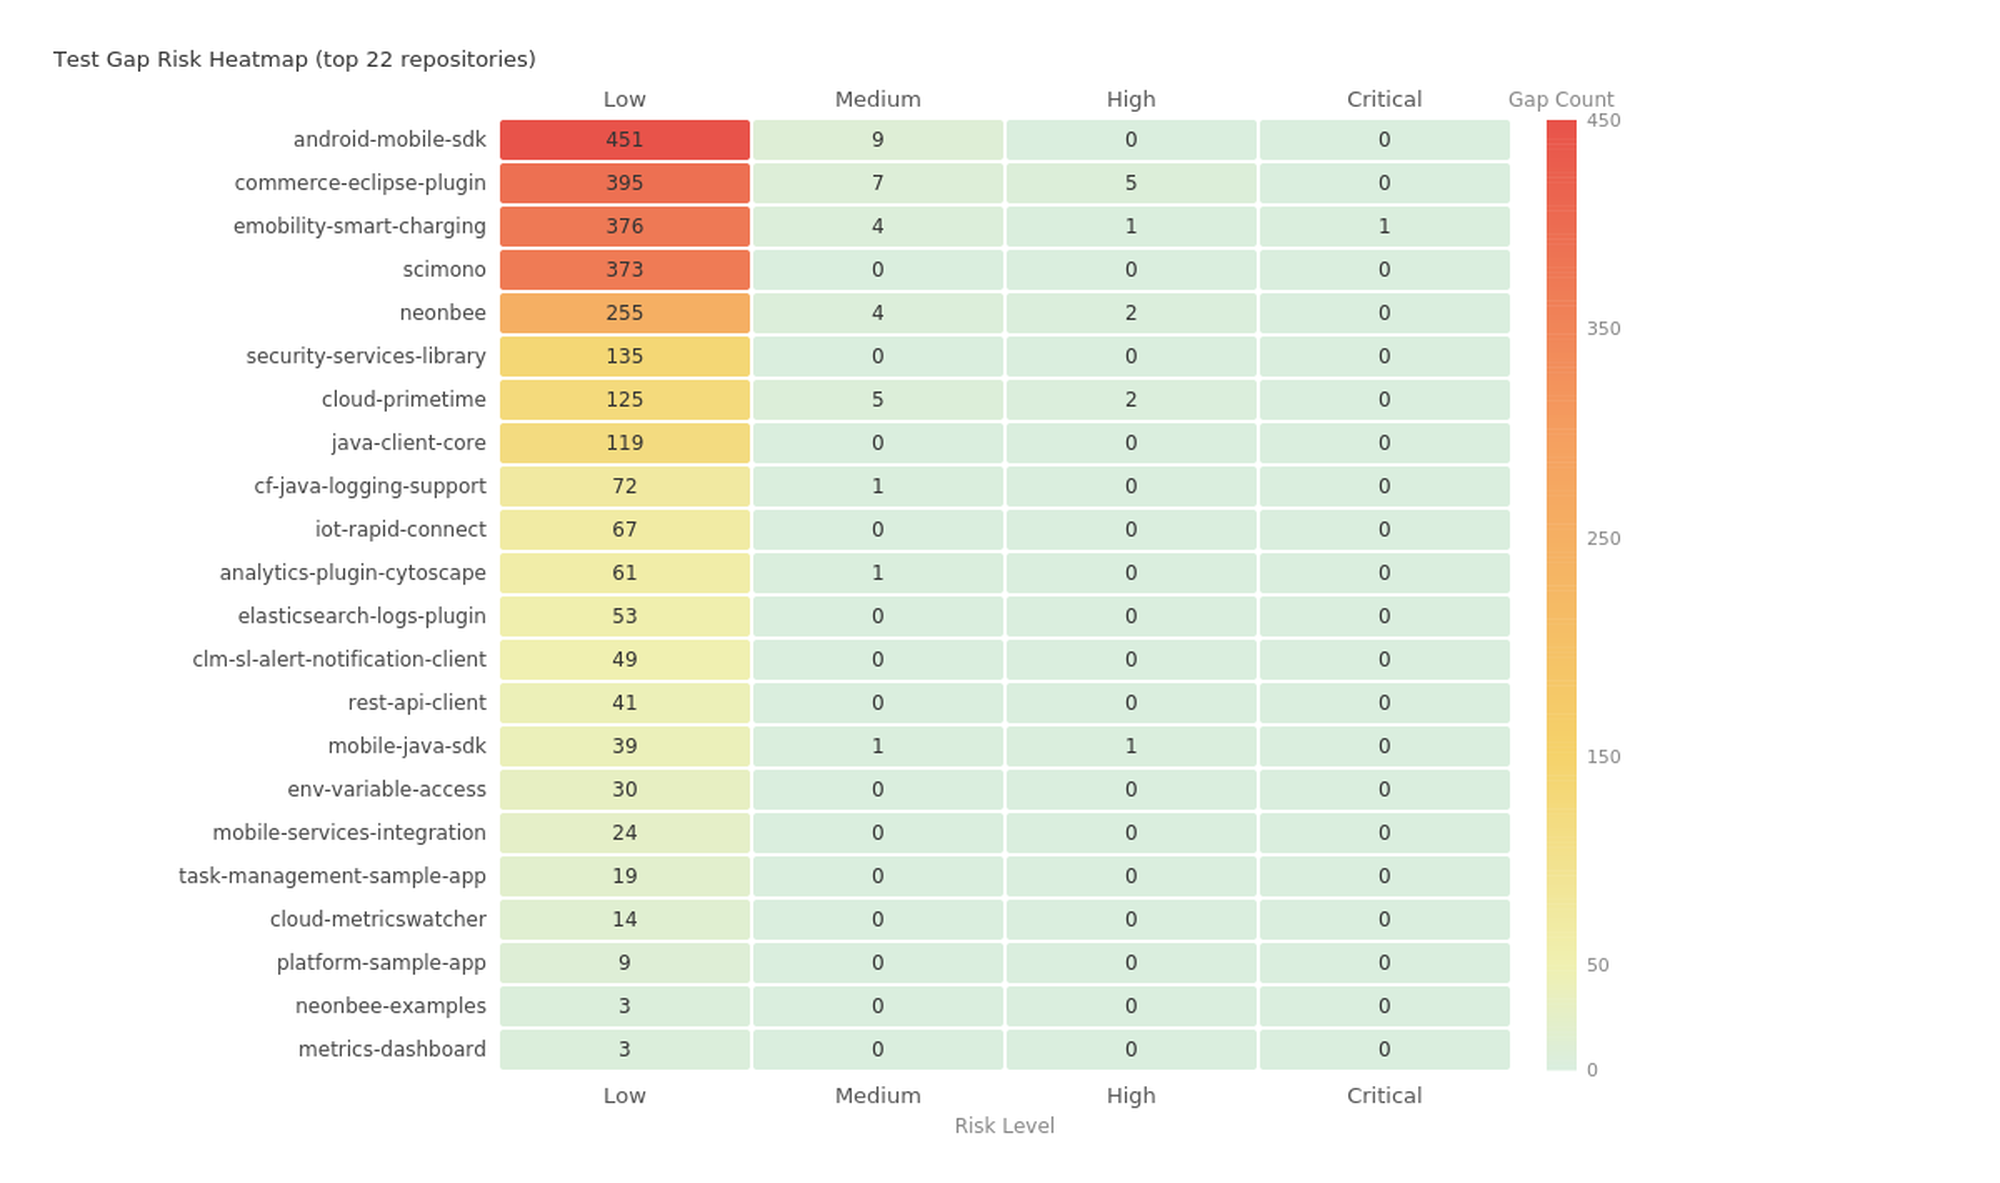
Test gap heatmap: untested methods bucketed by risk score across repositories. The reddest cells in the upper-right are the most dangerous gaps. An agent looking at this visualization knows immediately where to focus its test-writing efforts.
This is where the combination of quality metrics and test gap analysis becomes more powerful than either alone. An untested method with complexity 1 (a getter) is not a meaningful gap. An untested method with complexity 23 that's called by dozens of other methods? That's a 500+ risk-score gap that should have tests before anyone, human or agent, modifies it.
Trivial method filtering
Prethink's gap analysis filters out trivial methods (getters, setters, toString, hashCode, equals, single-statement methods) so the gap list surfaces only the methods that actually warrant tests. The suggested test class column (com.example.ServiceTest for com.example.Service) gives the agent a starting point.
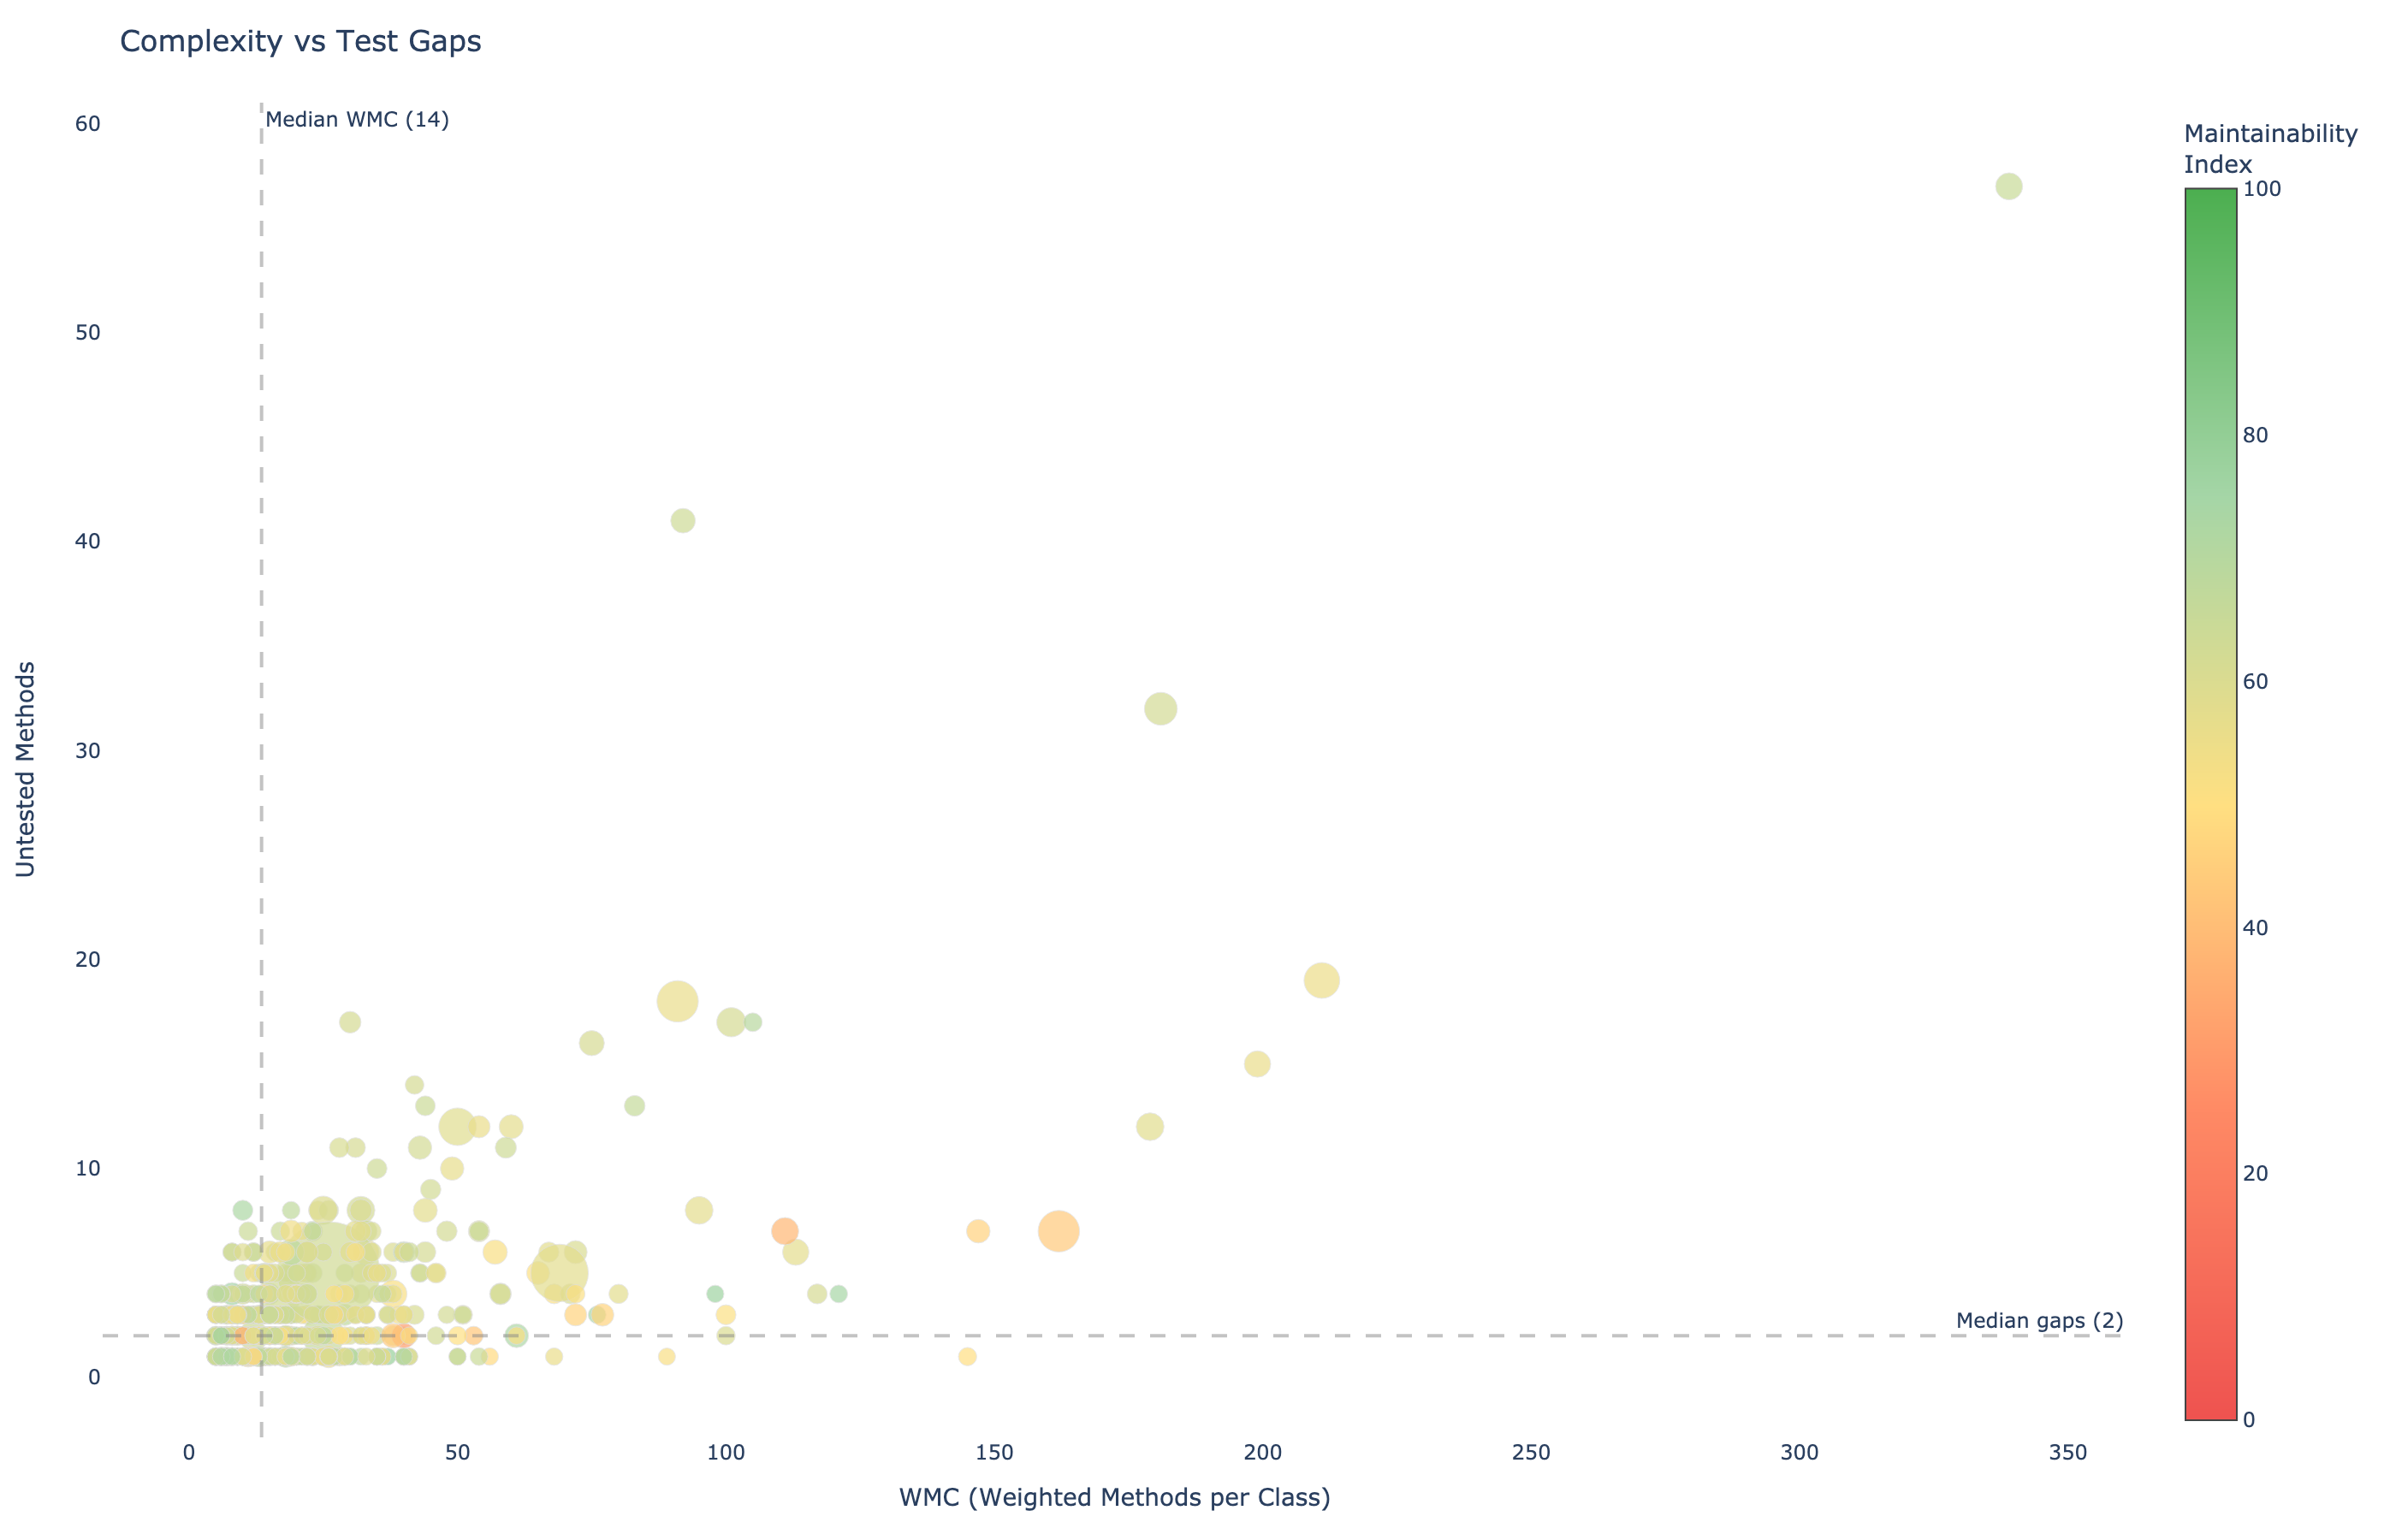
Bubble chart: WMC (x) vs untested methods (y). Size = total risk score. The dangerous intersection: complex AND untested.
How Agents Use This Context
Prethink materializes all of these metrics as files in the repository:
.moderne/context/
  method-quality-metrics.csv   # 56,000+ methods with all metrics
  class-quality-metrics.csv    # 2,900+ classes with WMC, LCOM4, TCC, CBO
  package-quality-metrics.csv  # 514 packages with coupling, cycles
  code-smells.csv              # God Classes, Feature Envy, Data Class
  test-gaps.csv                # Untested methods ranked by risk
The CLAUDE.md or .cursorrules file references these context files. When an agent opens the repository, it reads the context and knows:
- Which methods are complex and should be simplified before modification
- Which classes should be split (LCOM4 > 1) and shouldn't receive new methods
- Which packages are in dependency cycles and shouldn't gain new cross-package dependencies
- Which methods lack tests and should get them before being changed
Deterministic, versioned, authoritative
This isn't a dashboard that a human might or might not check. It's structured data that the agent consumes automatically, every time it works on the codebase. The context is deterministic and versioned. When Prethink runs on Monday and again on Friday, the agent gets consistent, up-to-date quality intelligence without any inference overhead. It doesn't need to scan the codebase itself, build an AST, or guess at the architecture. The analysis is done once, in advance, and the results are authoritative.
Capability Comparison
How Prethink's quality analysis compares to commonly used static analysis tools:
| Capability | Prethink | SonarQube | CodeClimate | Checkstyle / PMD | CodeScene |
|---|
| Method-Level Metrics |
| Cyclomatic complexity | Yes | Yes | Yes | Yes | Yes |
| Cognitive complexity | Yes | Yes | No | No | Yes |
| Max nesting depth | Yes | Partial | No | Yes | No |
| ABC metric (A/B/C decomposition) | Yes | No | Yes | No | No |
| Halstead volume / difficulty / est. bugs | Yes | No | No | No | No |
| Line count, parameter count | Yes | Yes | Yes | Yes | Yes |
| Class-Level Metrics |
| WMC (weighted methods per class) | Yes | No | No | No | No |
| LCOM4 (cohesion, "split into N") | Yes | No | No | No | No |
| TCC (tight class cohesion) | Yes | No | No | No | No |
| CBO (coupling between objects) | Yes | No | No | No | No |
| Maintainability index | Yes | Partial | Yes | No | No |
| Package / Architecture Metrics |
| Afferent / efferent coupling (Ca/Ce) | Yes | No | No | No | No |
| Instability (I) | Yes | No | No | No | No |
| Abstractness (A) | Yes | No | No | No | No |
| Distance from main sequence | Yes | No | No | No | No |
| Dependency cycle detection (Tarjan SCC) | Yes | No | No | No | No |
| Code Smell Detection |
| God Class (WMC + TCC + ATFD) | Yes | Rules-based | No | No | Yes |
| Feature Envy | Yes | Rules-based | No | No | Yes |
| Data Class | Yes | Rules-based | No | No | No |
| Severity rating (LOW–CRITICAL) | Yes | Yes | No | No | Yes |
| Metric evidence in output | Yes | No | No | No | No |
| Test Gap Analysis |
| Untested method identification | Yes | No | No | No | Yes |
| Risk scoring (complexity × call count) | Yes | No | No | No | No |
| Suggested test class | Yes | No | No | No | No |
| Trivial method filtering | Yes | N/A | N/A | N/A | No |
| Output & Integration |
| Agent-consumable files (CSV/MD in repo) | Yes | No | No | No | No |
| Dashboard UI | Via Moderne | Yes | Yes | No | Yes |
| Runs across org (1000+ repos, one command) | Yes | Per-repo | Per-repo | Per-repo | Per-repo |
| Polyglot (Java, Python, JavaScript) | Yes | Yes | Yes | Java only | Yes |
| CLAUDE.md / .cursorrules integration | Yes | No | No | No | No |
Notes on comparison
SonarQube detects code smells through a rules engine (pattern matching on AST) rather than composite metric thresholds. It identifies symptoms ("this method is too long") but doesn't provide the metric evidence that explains why ("WMC=264, TCC=0.11, ATFD=84"). CodeClimate computes ABC metric and a maintainability letter grade but lacks class-level cohesion/coupling metrics. Checkstyle/PMD are rule-based linters focused on style enforcement. CodeScene combines code metrics with behavioral analysis (code churn, team coupling). Its hotspot detection is complementary to Prethink's static analysis.
References
Complexity Metrics
- McCabe, T.J. (1976). "A Complexity Measure." IEEE Transactions on Software Engineering, SE-2(4), 308-320. doi:10.1109/TSE.1976.233837. Original cyclomatic complexity paper.
- Campbell, A. (2017). "Cognitive Complexity: A new way of measuring understandability." SonarSource. The cognitive complexity specification.
- Fitzpatrick, J. (1997). "Applying the ABC Metric to C, C++, and Java." C++ Report. The ABC metric definition.
- Halstead, M.H. (1977). Elements of Software Science. Elsevier. Halstead's operator/operand complexity measures.
Cohesion and Coupling Metrics
- Chidamber, S.R. & Kemerer, C.F. (1994). "A Metrics Suite for Object Oriented Design." IEEE Transactions on Software Engineering, 20(6), 476-493. doi:10.1109/32.295895. Defines WMC, CBO, RFC, DIT, NOC, and the original LCOM.
- Hitz, M. & Montazeri, B. (1995). "Measuring Coupling and Cohesion in Object-Oriented Systems." Proceedings of the International Symposium on Applied Corporate Computing. LCOM4 (connected components variant).
- Bieman, J.M. & Kang, B.K. (1995). "Cohesion and Reuse in an Object-Oriented System." Proceedings of the ACM Symposium on Software Reusability, 259-262. doi:10.1145/223427.211856. Tight Class Cohesion (TCC) and Loose Class Cohesion (LCC).
Architecture Metrics
- Martin, R.C. (1994). "OO Design Quality Metrics: An Analysis of Dependencies." Afferent/efferent coupling, instability, abstractness, distance from main sequence, and the Acyclic Dependencies Principle.
- Tarjan, R.E. (1972). "Depth-First Search and Linear Graph Algorithms." SIAM Journal on Computing, 1(2), 146-160. doi:10.1137/0201010. The strongly connected components algorithm used for dependency cycle detection.
Code Smell Detection
- Lanza, M. & Marinescu, R. (2006). Object-Oriented Metrics in Practice. Springer. doi:10.1007/3-540-39538-5. God Class, Feature Envy, and Data Class detection thresholds (WMC ≥ 47, TCC < 0.33, ATFD > 5).
- Fowler, M. (1999). Refactoring: Improving the Design of Existing Code. Addison-Wesley. Canonical catalog of code smells including Feature Envy, Data Class, and Long Method.
Maintainability
- Oman, P. & Hagemeister, J. (1992). "Metrics for Assessing a Software System's Maintainability." Proceedings of the IEEE International Conference on Software Maintenance. The Maintainability Index formula.
- Alves, T.L., Ypma, C., & Visser, J. (2010). "Deriving Metric Thresholds from Benchmark Data." Proceedings of the IEEE International Conference on Software Maintenance. doi:10.1109/ICSM.2010.5609747. Empirical methodology for setting metric thresholds from percentile distributions.
Prethink